
Ethereum started a downside correction below the $2,000 resistance level against the US Dollar. ETH is consolidating and there is a possibility of further decline towards $1,810.
- Ethereum started a downside correction below the $1,950 level.
- The price is now trading below $1,950 and the 100 hourly simple moving average.
- There was a break below a connecting bullish trend line with support near $1,925 on the hourly chart of ETH/USD (data feed via Kraken).
- If it stays below the pivot level of $1,950, the pair may continue to decline.
Ethereum price drop
Ethereum made some attempts to gain strength above the $2,000 resistance area. However, ETH failed to extend gains and started a downside correction below the $1,950 level.
There was a clear move below the $1,920 level and the 100 hourly simple moving average. Besides, there was a break below a connecting bullish trend line with support near $1,925 on the hourly chart of ETH/USD. Ether price also declined below the $1,900 level.
A low is formed near $1,862 and the price is now consolidating losses. It is now trading below $1,950 and the 100 hourly simple moving average.
An immediate upside resistance is near the $1,900 level. It is near the 23.6% Fib retracement level of the recent decline from the $2,030 high to $1,862 low. The first major resistance is near the $1,945 and $1,950 levels.
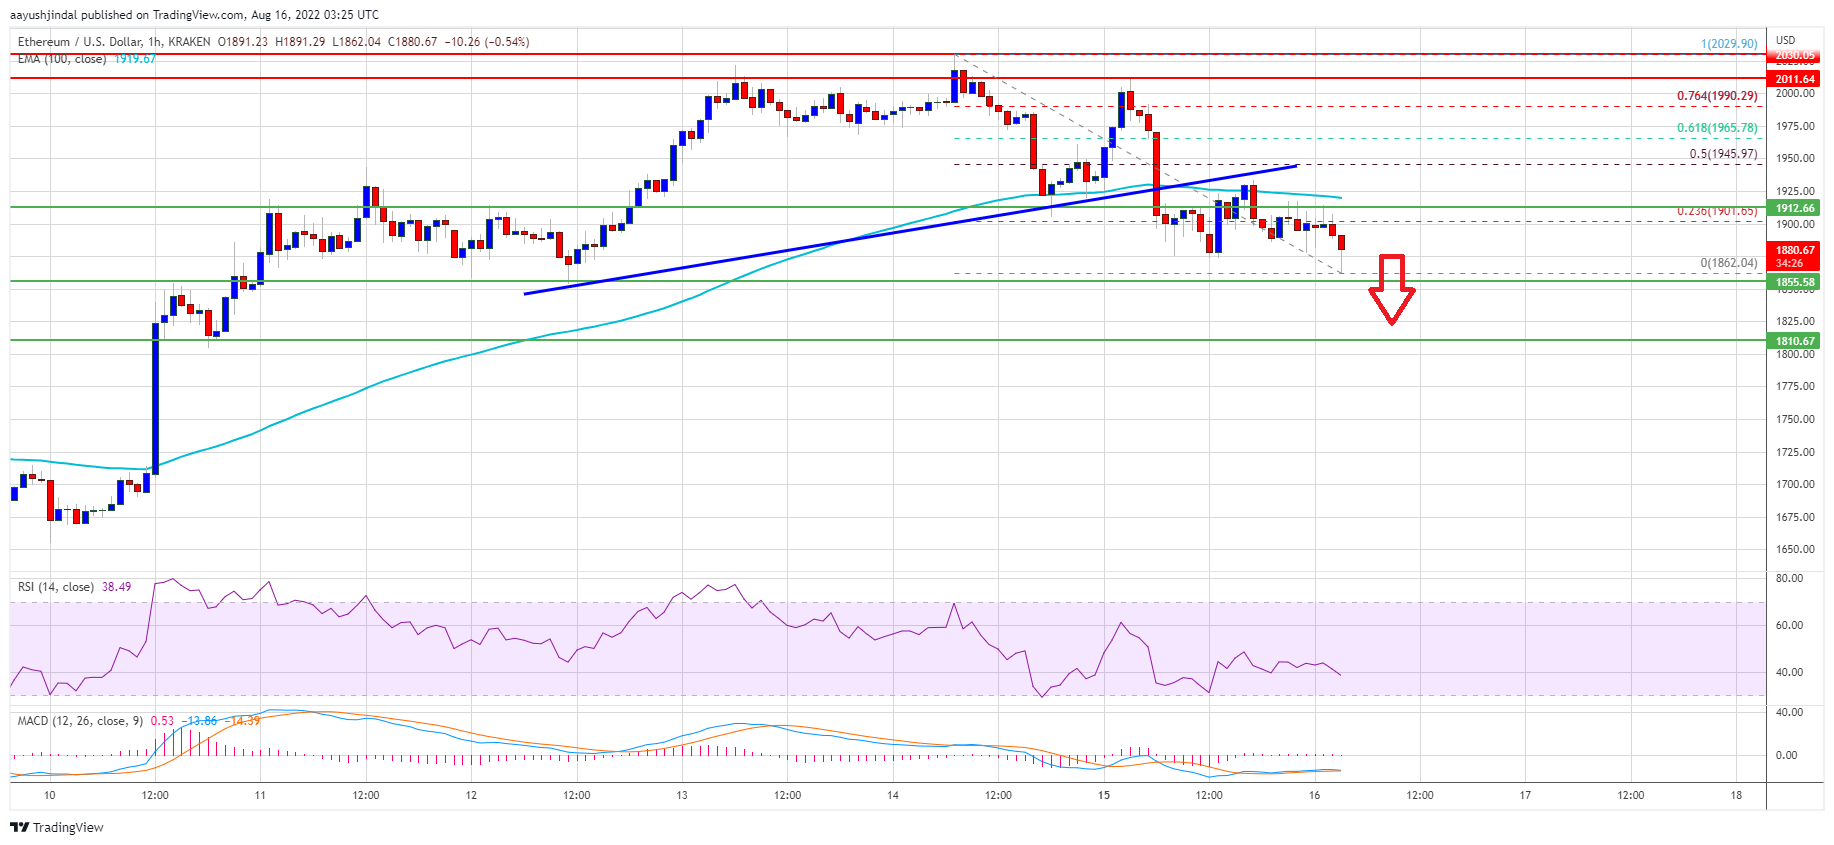
Source: ETHUSD on TradingView.com
The 50% Fib retracement level of the recent decline from the $2,030 high to $1,862 low is also near the $1,950 level to act as a major resistance. A clear move above the $1,950 level could start a steady rise towards the $2,000 level. If there is more upside, the price could move towards the $2,080 resistance area in the near term.
More losses in ETH?
If Ethereum fails to rise above the $1,950 resistance, it could continue with a downside move. An initial support on the downside is near the $1,862 area.
The next major support is near the $1,850 level, below which there is a risk of a move towards the $1,810 level. If the bears remain active, the price could even decline towards the $1,720 level.
technical indicators
hourly macd , The MACD for ETH/USD is now losing momentum in the bullish zone.
hourly rsi , The RSI for ETH/USD is now below the 50 level.
Key Support Level – $1,860
Key Resistance Level – $1,950


