
Bitcoin is struggling below $24,500 against the US Dollar. BTC could continue to decline below the $23,650 and $23,500 support levels.
- Bitcoin is slowly turning lower and is trading below the $25,000 level.
- The price is now trading below the $24,200 level and the 100 hourly simple moving average.
- There is a major bearish trend line forming with resistance near $24,020 on the hourly chart of the BTC/USD pair (data feed from Kraken).
- The pair could extend losses below the $23,650 and $23,500 support levels in the near term.
bitcoin price red
Bitcoin price started a slow and steady decline from the $25,000 resistance area. BTC moved into a short-term bearish zone with a break below the $24,650 and $24,500 levels.
There was a break below the $24,000 level and the 100 hourly simple moving average. The price traded as low as $23,673 and it is currently consolidating losses. On the upside, an immediate resistance is near the $24,000 level. It is close to the 23.6% Fib retracement level of the recent decline from the $25,200 high to $23,673 low.
There is also a major bearish trend line forming with resistance near $24,020 on the hourly chart of the BTC/USD pair. The first major resistance on the upside is near the $24,250 level and the 100 hourly simple moving average.
The next major resistance is near the $24,450 area. It is near the 50% Fib retracement level of the recent decline from the $25,200 high to $23,673 low. Another upside could be starting above the $24,450 and $24,500 resistance levels.
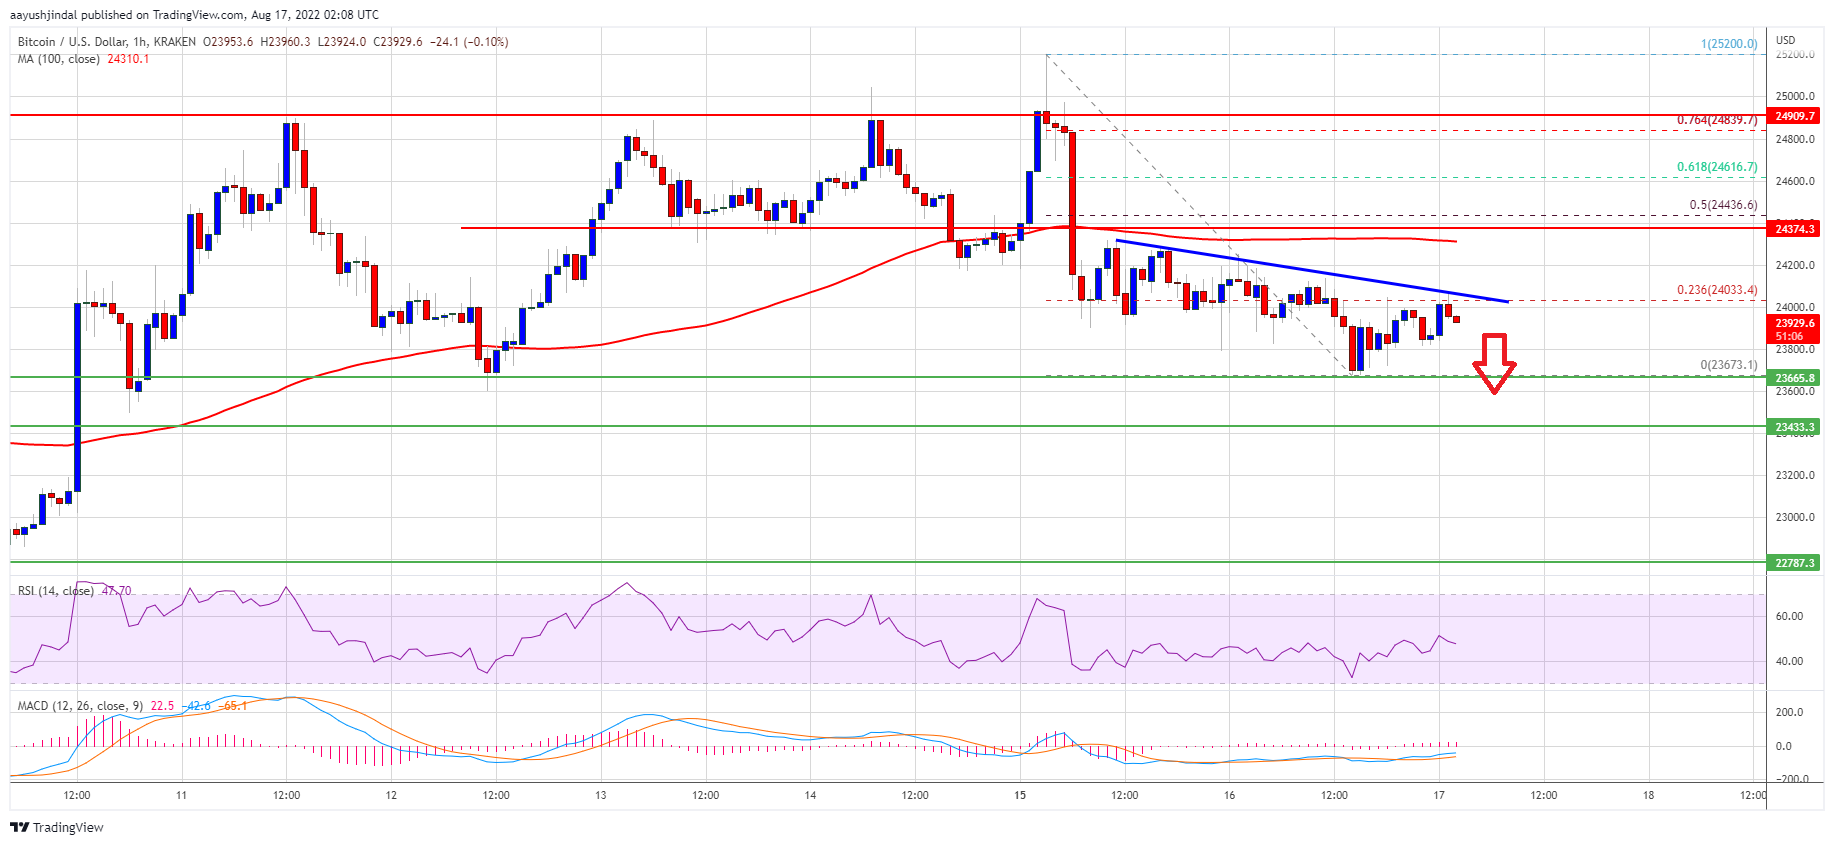
Source: BTCUSD on TradingView.com
In this case, the price is likely to rise towards the $25,000 resistance level. Any further gains could send the price towards the $25,800 level.
More losses in BTC?
If bitcoin fails to clear the $24,450 resistance area, it could continue to move lower. On the downside, immediate support is near the $23,675 level.
The next major support is now near the $23,450 level. A further close below the $23,450 level is likely to put a lot of pressure on the bulls. In this case, the price could decline towards the $22,750 level.
Technical Indicators:
Hourly MACD – The MACD is now gaining momentum in the bearish zone.
Hourly RSI (Relative Strength Index) – The RSI for BTC/USD is now below the 50 level.
Key Support Level – $23,650, followed by $23,500.
Key Resistance Levels – $24,020, $24,450 and $24,500.


