
Bitcoin is showing some bearish signs below the $24,000 resistance area against the US Dollar. BTC is declining and it may test the $22,000 support area.
- Bitcoin is slowly moving below the $24,000 pivot level.
- The price is now trading below the $23,500 level and the 100 hourly simple moving average.
- There is a major bearish trend line forming with resistance near $23,300 on the hourly chart of the BTC/USD pair (data feed from Kraken).
- The pair may continue to move towards the $22,000 support level in the near term.
bitcoin price starts falling
Bitcoin price failed to start a fresh rise above the $24,000 resistance area. The price started a fresh decline and declined below the $23,500 support area.
There was a clear upside move from the 23.6% Fib retracement level of $20,695 low to $24,670 high. The price is now showing bearish signs below the $23,500 level and the 100 hourly simple moving average.
There is also a major bearish trend line forming with resistance near $23,300 on the hourly chart of the BTC/USD pair. Current price action suggests that bitcoin could continue to decline with immediate support at $22,800.
On the upside, the price is facing resistance near the $23,300 level and the trend line. The next major resistance is near the $23,750 area and the 100 hourly simple moving average.
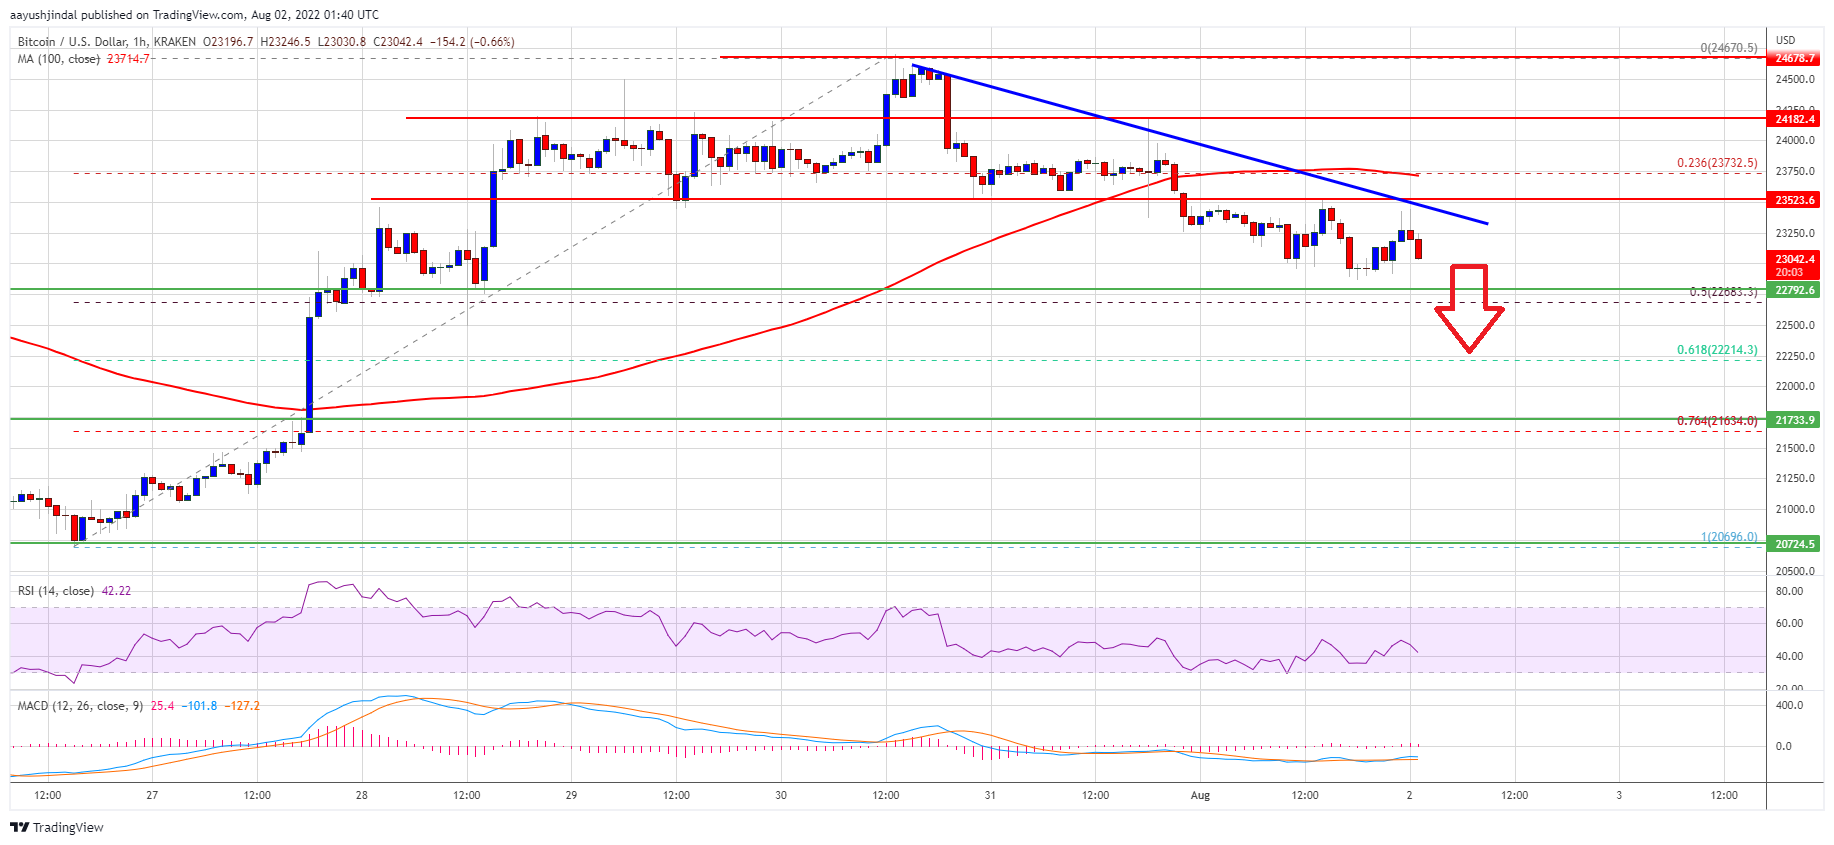
Source: BTCUSD on TradingView.com
The main resistance area could be near the $24,000 area. A fresh increase could be set above the $24,000 resistance area. In the specified case, the price is likely to move higher towards the $24,500 level. The next major resistance is near the $25,000 level.
More losses in BTC?
If bitcoin fails to clear the $23,300 resistance area, it could continue to move lower. On the downside, immediate support is near the $22,800 level.
The next major support is now near the $22,680 level. It is near the 50% Fib retracement level of the upward move from $20,695 low to $24,670 high. Any further losses could send the price towards the $22,000 level.
Technical Indicators:
Hourly MACD – The MACD is now gaining momentum in the bearish zone.
Hourly RSI (Relative Strength Index) – The RSI for BTC/USD is now below the 50 level.
Key Support Level – $22,680, followed by $22,000.
Key Resistance Levels – $23,300, $23,750 and $24,000.


