
Bitcoin started a fresh decline with the $32,400 resistance level against the US Dollar. BTC must stay above $29,450 to avoid further downside.
- Bitcoin started a fresh decline after failing to clear the $32,400 resistance area.
- The price is now trading below the $30,000 level and the 100 hourly simple moving average.
- There was a break below a major bullish trend line with support near $31,750 on the hourly chart of the BTC/USD pair (data feed from Kraken).
- The pair could extend its decline if it breaks the $29,450 and $29,400 support levels.
bitcoin price trims profit
Bitcoin price started another decline above the $32,400 resistance area. There was a steady decline below the $32,000 and $31,500 levels.
More importantly, there was a break below a major bullish trend line with support near $31,750 on the hourly chart of the BTC/USD pair. The pair was trading below the 50% Fibonacci retracement level of the upward move from $28,250 low to $32,400 high.
Bitcoin price is now trading below the $30,000 level and the 100 hourly simple moving average. The price is also consolidating above the 61.8% Fib retracement level of the upward move from $28,250 low to $32,400 high.
An immediate upside resistance is near the $30,000 level. The next major resistance is near the $30,400 level and the 100 hourly simple moving average.
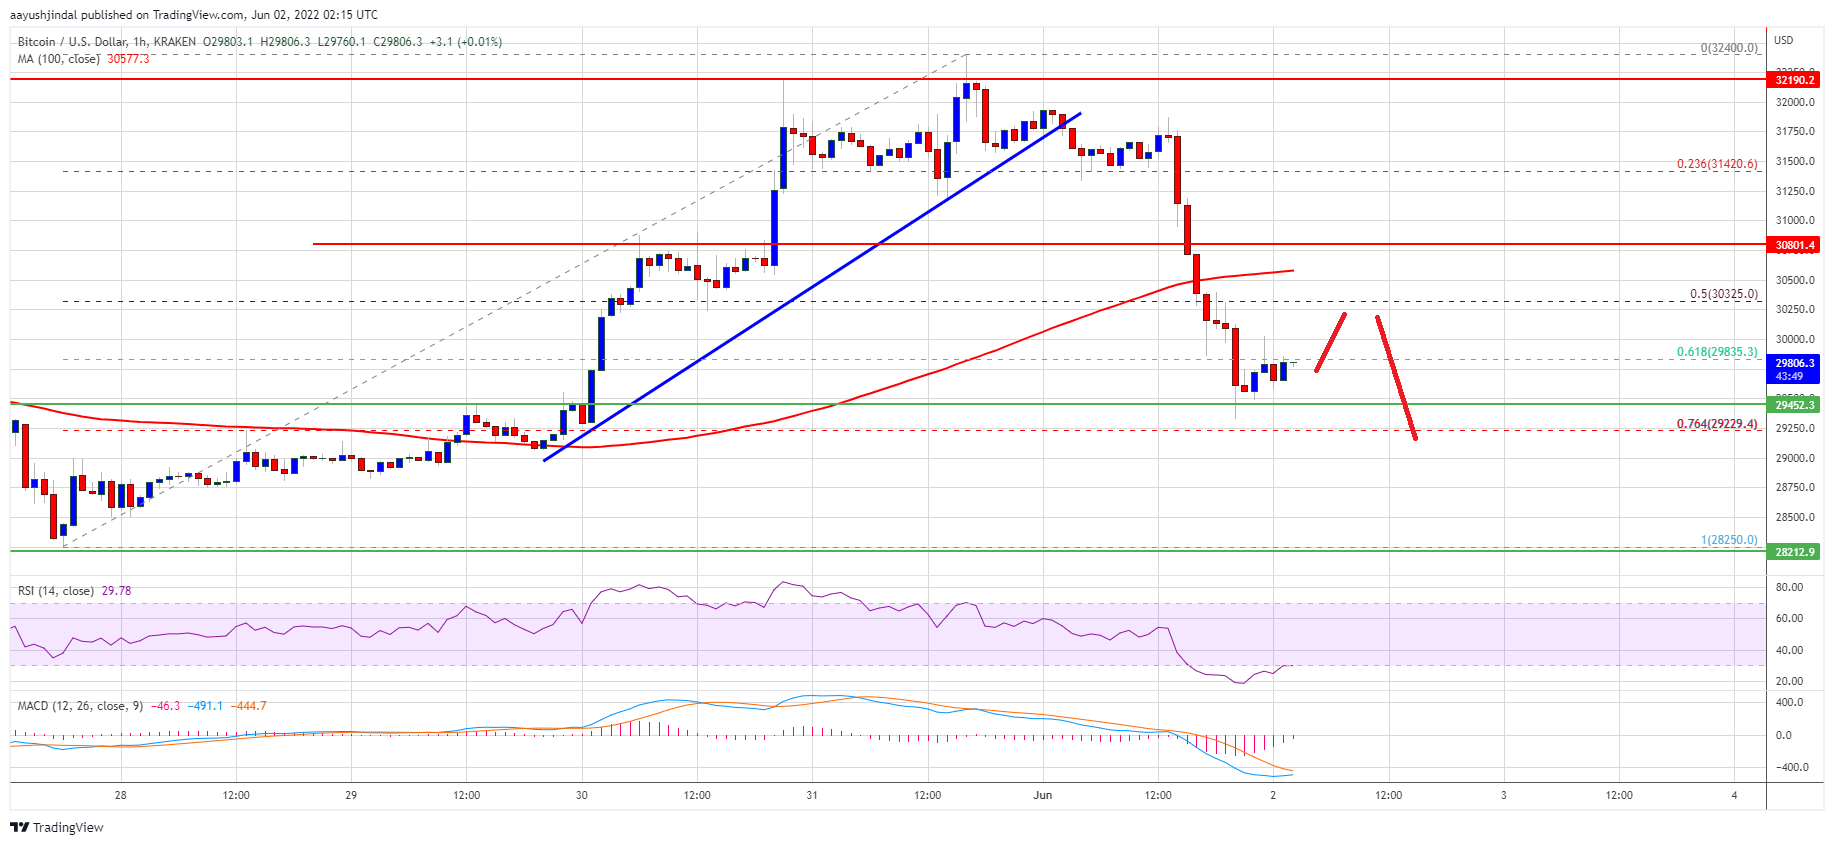
Source: BTCUSD on TradingView.com
A clear move above the $30,400 resistance could start another rise. In the specified case, the price is likely to rise towards the $30,800 resistance area. The next major resistance is near the $32,000 level.
More losses in BTC?
If bitcoin fails to clear the $30,400 resistance area, it could continue to move lower. On the downside, immediate support is near the $29,450 level.
The next major support is near the $29,250 level. A break below the $29,250 support could probably put a lot of pressure on the bulls. In the specified case, the price may revisit the $28,250 support area. Any further losses could send the price towards the $27,500 level.
Technical Indicators:
Hourly MACD – The MACD is now losing momentum in the bearish zone.
Hourly RSI (Relative Strength Index) – The RSI for BTC/USD is correcting above the 30 level.
Key Support Level – $29,450, followed by $28,250.
Key Resistance Levels – $30,000, $30,400 and $30,800.


