
Bitcoin is consolidating above the $19,500 support level against the US Dollar. BTC could start a major uptrend given the recent rise in Ether.
- Bitcoin is still trading near the $20,000 area and below the $20,500 resistance area.
- The price is now trading below the $20,000 level and the 100 hourly simple moving average.
- There is a major bullish trend line forming with support near $19,700 on the hourly chart of the BTC/USD pair (data feed from Kraken).
- As long as there is no clear move below the $19,600 and $19,500 levels, the pair could start a decent rise.
Bitcoin Price Eyes Fresh Growth
Bitcoin price is staying below the $20,500 and $20,550 resistance levels. Recently, BTC formed a support base above $19,600 and started an upside correction.
There was a move above the $19,800 resistance and the 100 hourly simple moving average. The bulls were able to push the price above the 50% Fib retracement level of the $20,398 high to $19,600 low.
Finally, there was a rise above the $20,000 resistance level. However, the bears were active near the $20,100 area. Bitcoin price failed to move higher from the 61.8% Fibonacci retracement level of the $20,398 high to $19,600 low.
It is now trading below the $20,000 level and the 100 hourly simple moving average. There is also a major bullish trend line forming with support near $19,700 on the hourly chart of the BTC/USD pair.
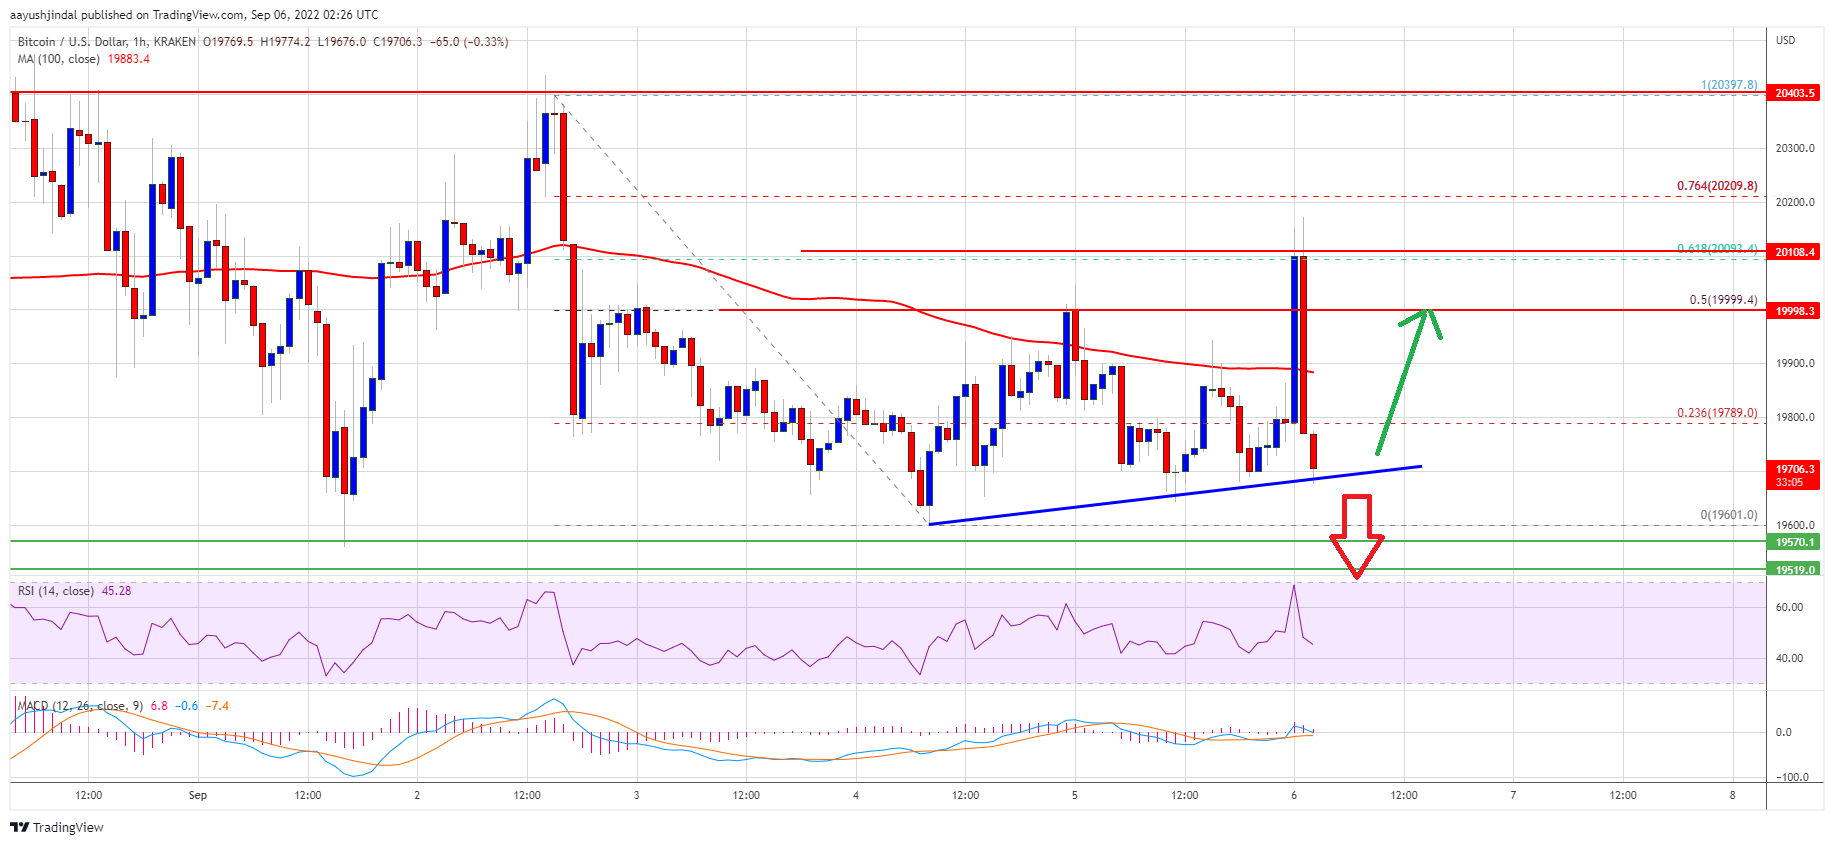
Source: BTCUSD on TradingView.com
On an upside, immediate resistance is near the $19,900 level and the 100 hourly simple moving average. The next major resistance is near the $20,100 level. The main resistance is still near the $20,400 and $20,500 levels. A clear move above the $20,500 resistance could send the price towards $21,200. Any further gains could start pushing the price towards the $22,000 resistance area.
Downside Break in BTC?
If bitcoin fails to clear the $20,400 resistance area, it could start another decline. On the downside, immediate support is near the $19,700 area and the trend line.
The next major support is near the $19,600 level. The main support is near the $19,500 level. A clear move below the $19,500 support could start a major decline. In the alleged case, the price might test the $18,500 support level.
Technical Indicators:
Hourly MACD – The MACD is now losing momentum in the bullish zone.
Hourly RSI (Relative Strength Index) – The RSI for BTC/USD is now near the 50 level.
Key Support Level – $19,700, followed by $19,500.
Major resistance levels – $20,000, $20,400 and $20,500.


