Bitcoin is consolidating near $20,000 against the US Dollar. BTC could start a decent recovery wave if it clears the $20,550 resistance area.
- Bitcoin is showing some positive signs above the $20,000 resistance level.
- The price is now trading above the $20,000 level and the 100 hourly simple moving average.
- There is a connecting bearish trend line forming with resistance near $20,340 on the hourly chart of the BTC/USD pair (data feed from Kraken).
- The pair must clear the $20,340 area and $20,550 to start a sustained rise.
bitcoin price struggle
Bitcoin price started a minor upside correction above the $20,000 resistance area. BTC also cleared the $20,200 resistance area and the 100 hourly simple moving average.
There was a move above the $20,500 level but the bulls were struggling to push the price higher. A high was formed near $20,576 before a bearish reaction. The price declined heavily below the $20,000 level and the 100 hourly simple moving average.
However, it remained above the $19,500 support area. A low is formed near $19,555 and the price is now rising. There was a move above the 50% Fib retracement level of the recent decline from $20,576 high to $19,555 low.
Bitcoin is now trading above the $20,000 level and the 100 hourly simple moving average. On the upside, an immediate resistance is near the $20,340 level.
A connecting bearish trend line is also forming with resistance near $20,340 on the hourly chart of the BTC/USD pair. The trend line is near the 76.4% Fib retracement level of the recent decline from $20,576 high to $19,555 low.
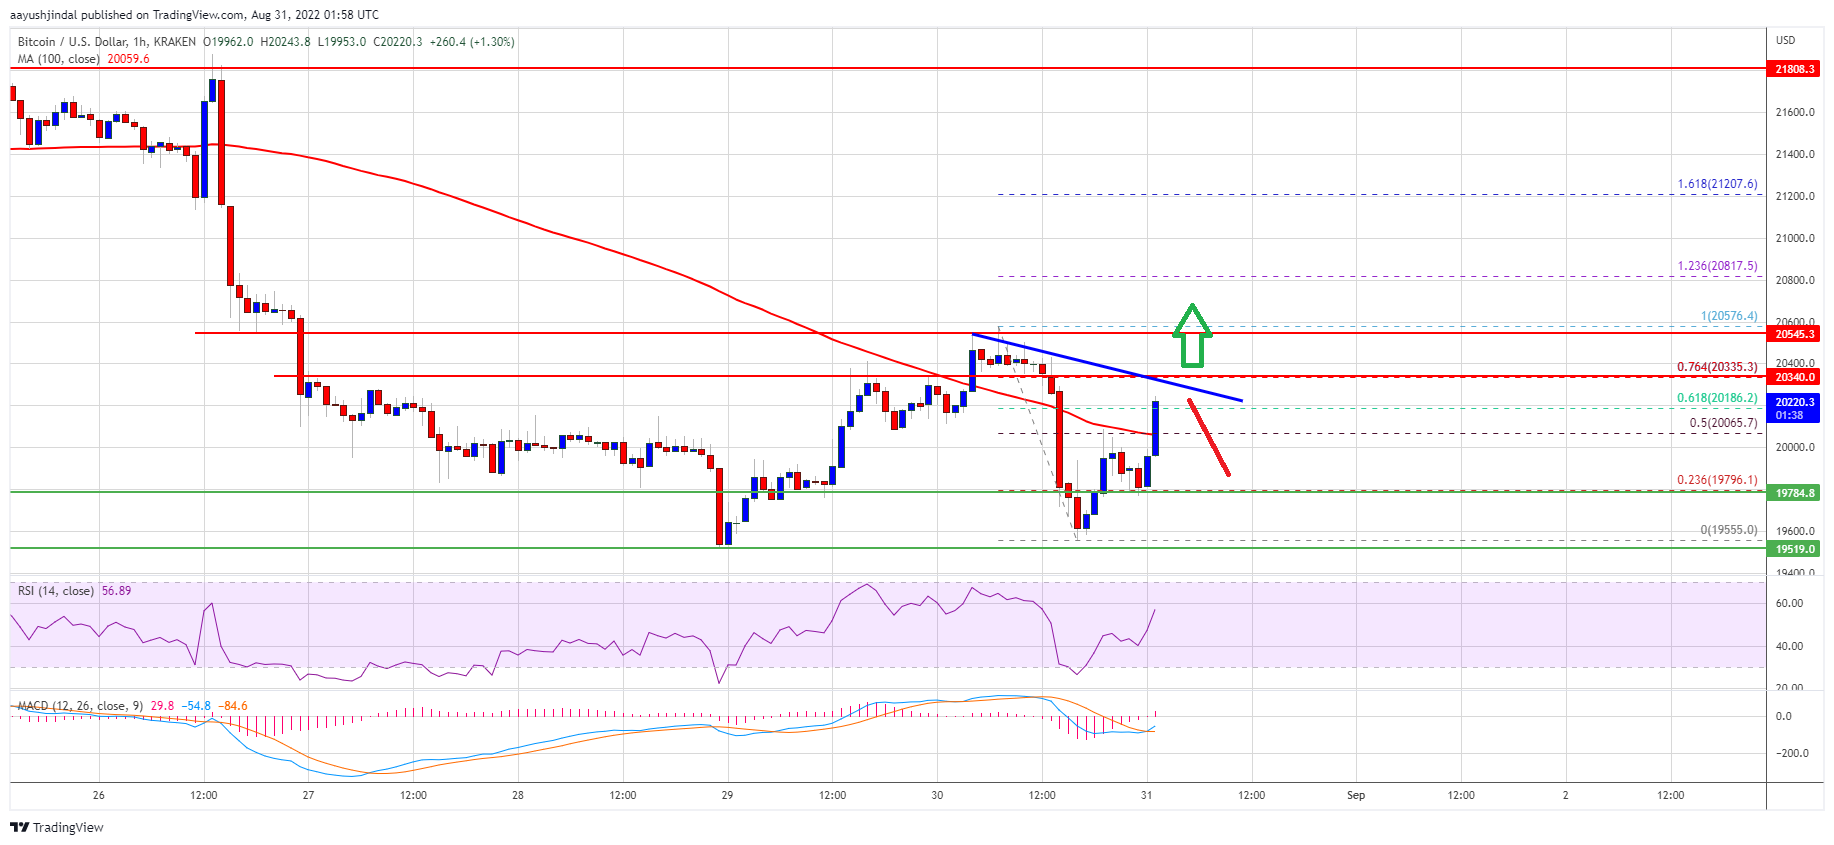
Source: BTCUSD on TradingView.com
The next major resistance is near the $20,550 level. A clear move above the $20,550 resistance could send the price towards $21,000. Any further gains could send the price towards the $22,000 resistance area.
Recent fall in BTC?
If bitcoin fails to clear the $20,550 resistance area, it could start another decline. On the downside, immediate support is near the $20,000 area.
The next major support is near the $19,780 level. A break below the $19,780 support could propel the price towards $19,550. Any further losses could result in a call for new lows below $19,500.
Technical Indicators:
Hourly MACD – The MACD is now gaining momentum in the bullish zone.
Hourly RSI (Relative Strength Index) – The RSI for BTC/USD is now above the 50 level.
Key Support Level – $19,780, followed by $19,500.
Major resistance levels – $20,340, $20,550 and $21,000.


