
Bitcoin moved towards the $25,000 support area against the US Dollar. BTC is now recovering and there may be an upside break above the key $30,000 resistance area.
- Bitcoin found support above $25,000 and started an upside correction.
- The price is still trading below $30,000 and the 100 hourly simple moving average.
- There is a major bearish trend line forming with resistance near $30,000 on the hourly chart of the BTC/USD pair (data feed from Kraken).
- The pair must clear the $30,000 barrier to move into positive territory and start a real recovery.
Bitcoin price starts recovery
Bitcoin price remains in a bearish zone below the $30,000 support area. BTC extended its decline and traded below the $28,000 level.
There was a spike below the $26,000 level and the price was trading a new multi-month low at $25,332. A base was formed above $25,000 and the price started a fresh upward move. There was a clear break above the $26,500 and $27,500 resistance levels.
The price climbed above the 50% Fib retracement level of the recent decline from the $32,130 high to $25,332 low. However, it is still trading below $30,000 and the 100 hourly simple moving average.
There is also a major bearish trend line forming with resistance near $30,000 on the hourly chart of the BTC/USD pair. The next major resistance is near the $30,500 area and the 100 hourly simple moving average. It is near the 76.4% Fib retracement level of the recent decline from the $32,130 high to $25,332 low.
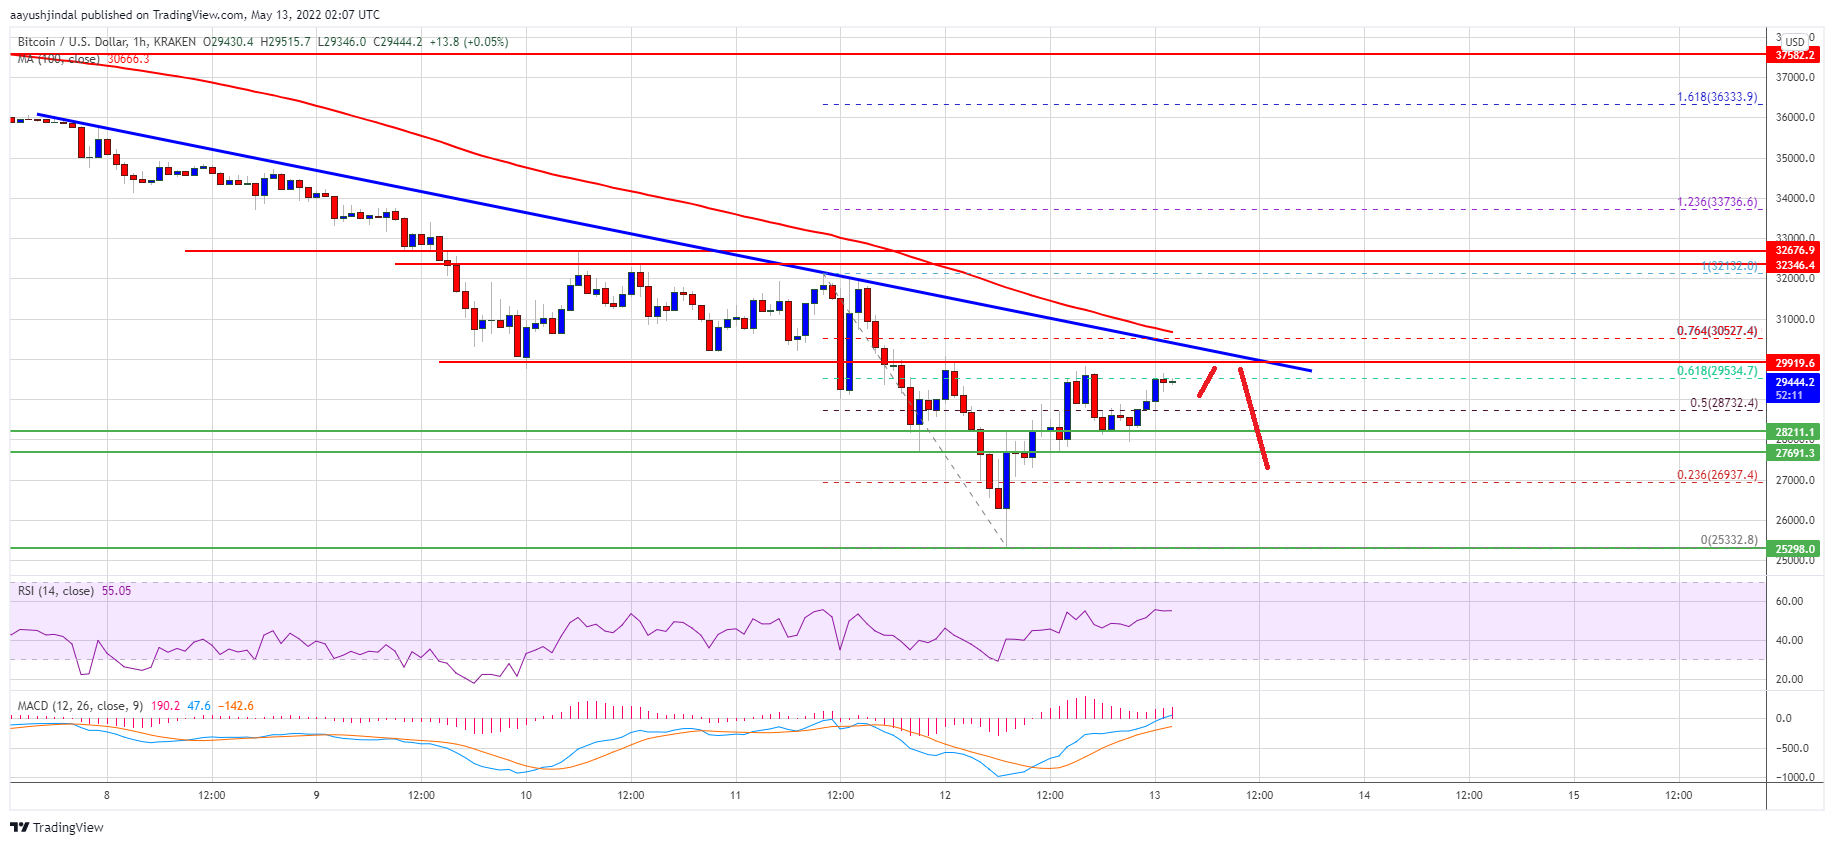
Source: BTCUSD on TradingView.com
A clear move above the $30,000 and $30,500 resistance levels could start a fresh rise in the coming sessions. The next major resistance could be near the $31,500 level, above which the price could move higher above $32,000.
Recent fall in BTC?
If bitcoin fails to clear the $30,000 resistance area, it could start a fresh decline. On the downside, an immediate support is near the $28,800 level.
The next major support is seen near the $27,650 level. A downside break and close below the $27,650 support could accelerate losses. The next major support is likely to be near the $26,200 level, below which the bears are likely to aim a move towards the $25,500 support area.
Technical Indicators:
Hourly MACD – The MACD is now gaining momentum in the bullish zone.
Hourly RSI (Relative Strength Index) – The RSI for BTC/USD is now above the 50 level.
Key Support Level – $28,200, followed by $27,650.
Major resistance levels – $30,000, $30,500 and $31,500.


