
Bitcoin is trending towards the key $29,500 support against the US Dollar. BTC must stay above $29,500 to avoid a major decline.
- Bitcoin is struggling to stay above the $29,500 support area.
- The price is now trading below the $30,500 level and the 100 hourly simple moving average.
- There is a major contracting triangle forming with resistance near $31,050 on the hourly chart of the BTC/USD pair (data feed from Kraken).
- If there is a break below the $29,500 support, the pair could start a major decline.
Bitcoin price is showing bearish signs
Bitcoin price failed to gain strength above the $31,200 and $31,500 resistance levels. However, there was no clear move and the price started a fresh decline below $31,000.
There was a move below the $30,850 and $30,500 support levels. The price even declined below the $30,000 level and closed below the 100 hourly simple moving average. It traded near the $29,500 support area and formed a low of $29,561 low.
Bitcoin is now consolidating losses and trading above the $29,800 level. An immediate upside resistance is near the $30,030 level. It is close to the 23.6% Fib retracement level of the recent decline from the $31,550 high to $29,561 low.
The first major resistance is near the $30,500 level and the 100 hourly SMA. It is near the 50% Fib retracement level of the recent decline from the $31,550 high to $29,561 low.
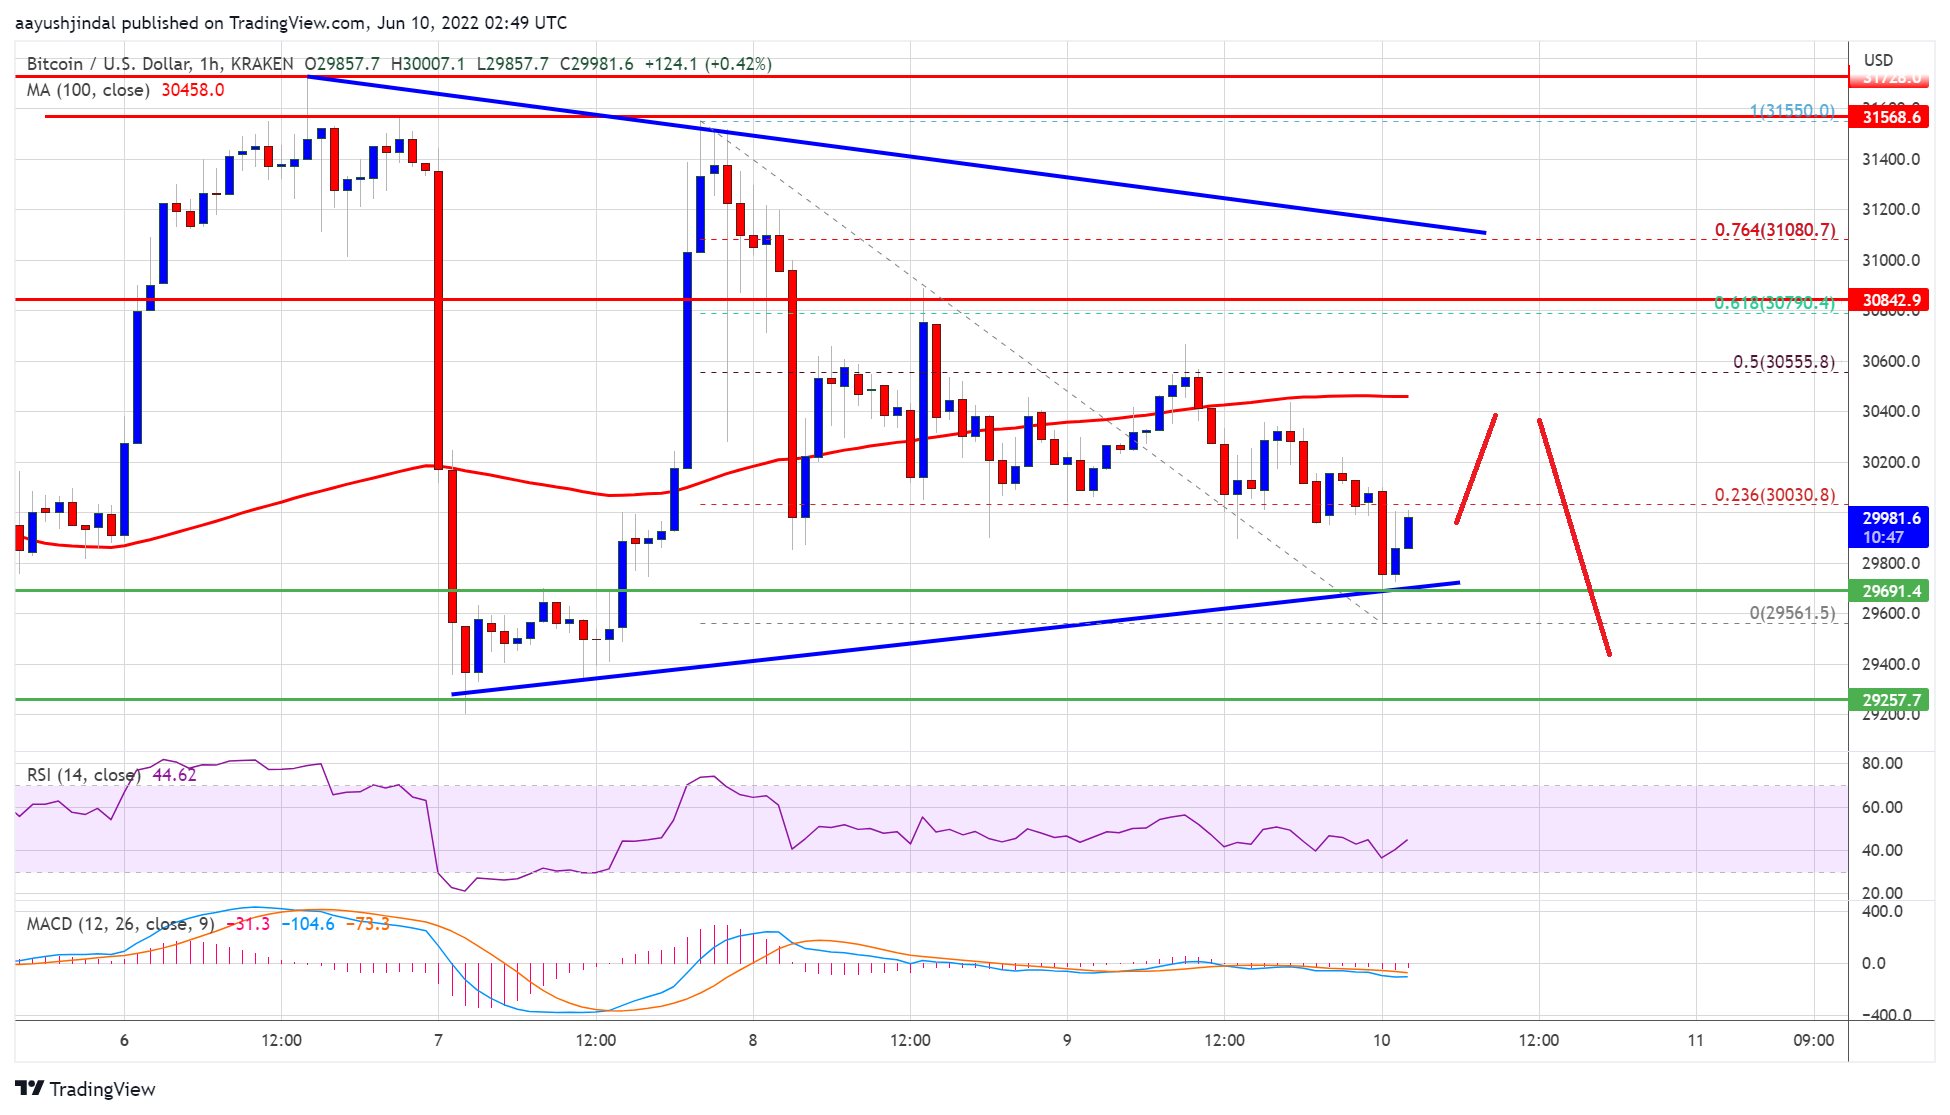
Source: BTCUSD on TradingView.com
The main resistance is near the $31,000 level. There is also a major contracting triangle forming with resistance near $31,050 on the hourly chart of the BTC/USD pair. A clear move above the $31,050 resistance could push the price higher. The next major resistance could be $31,500, above which the price could start a decent rise.
Downside Break in BTC?
If bitcoin fails to clear the $31,050 resistance area, it could start another decline. On the downside, an immediate support is near the $29,650 level.
The next major support is near the $29,500 level. A break below the $29,500 support could put a lot of pressure on the bulls. In the specified case, the price is likely to decline towards the $28,500 support area in the near term.
Technical Indicators:
Hourly MACD – The MACD is now losing momentum in the bearish zone.
Hourly RSI (Relative Strength Index) – The RSI for BTC/USD is now below the 50 level.
Key Support Level – $29,800, followed by $29,500.
Key Resistance Levels – $30,500, $31,050, and $31,500.


