
The price of the KuCoin token declined sharply during the US session on Friday. The coin fell to a session low of $19.34, its lowest level since March 28 this year. KCS has declined more than 12% from its YTD high, taking its total market cap to over $1.4 billion.
Is KCS a good buy?
KuCoin is one of the largest companies in the cryptocurrency industry. The firm runs a popular exchange that handles billions of dollars every day.
Like other companies in the industry, KuCoin has launched its own personal token known as KCS, which is used to incentivize the use of the platform. Holders of the coin usually receive a discount whenever they use it for business.
The price of KuCoin has been better than other cryptocurrencies in the past few weeks. This performance is mostly due to the funds that the company raised last week. The firm raised $150 million from a group of investors such as Jump Trading, Circle Ventures and Matrix Partners. It valued the firm at $10 billion.
The new round of funding was surprising for two main reasons. First, many venture capital firms are struggling because the value of their holdings has fallen. For example, Tiger Global and SoftBank combined lost nearly $50 billion this year.
Read our comprehensive KuCoin Review Here.
Second, this round was surprising as the crypto industry is struggling as it was revealed in Coinbase’s most recent results. The firm lost more than $400 million in the first quarter. Worse yet, its market cap as a publicly traded company has fallen to nearly $14 billion. At its peak, it was valued at over $75 billion.
KuCoin intends to use the funds to expand its business to other areas such as Web3. This would include the creation of decentralized exchanges, games, and other products.
KuCoin Token Price Prediction
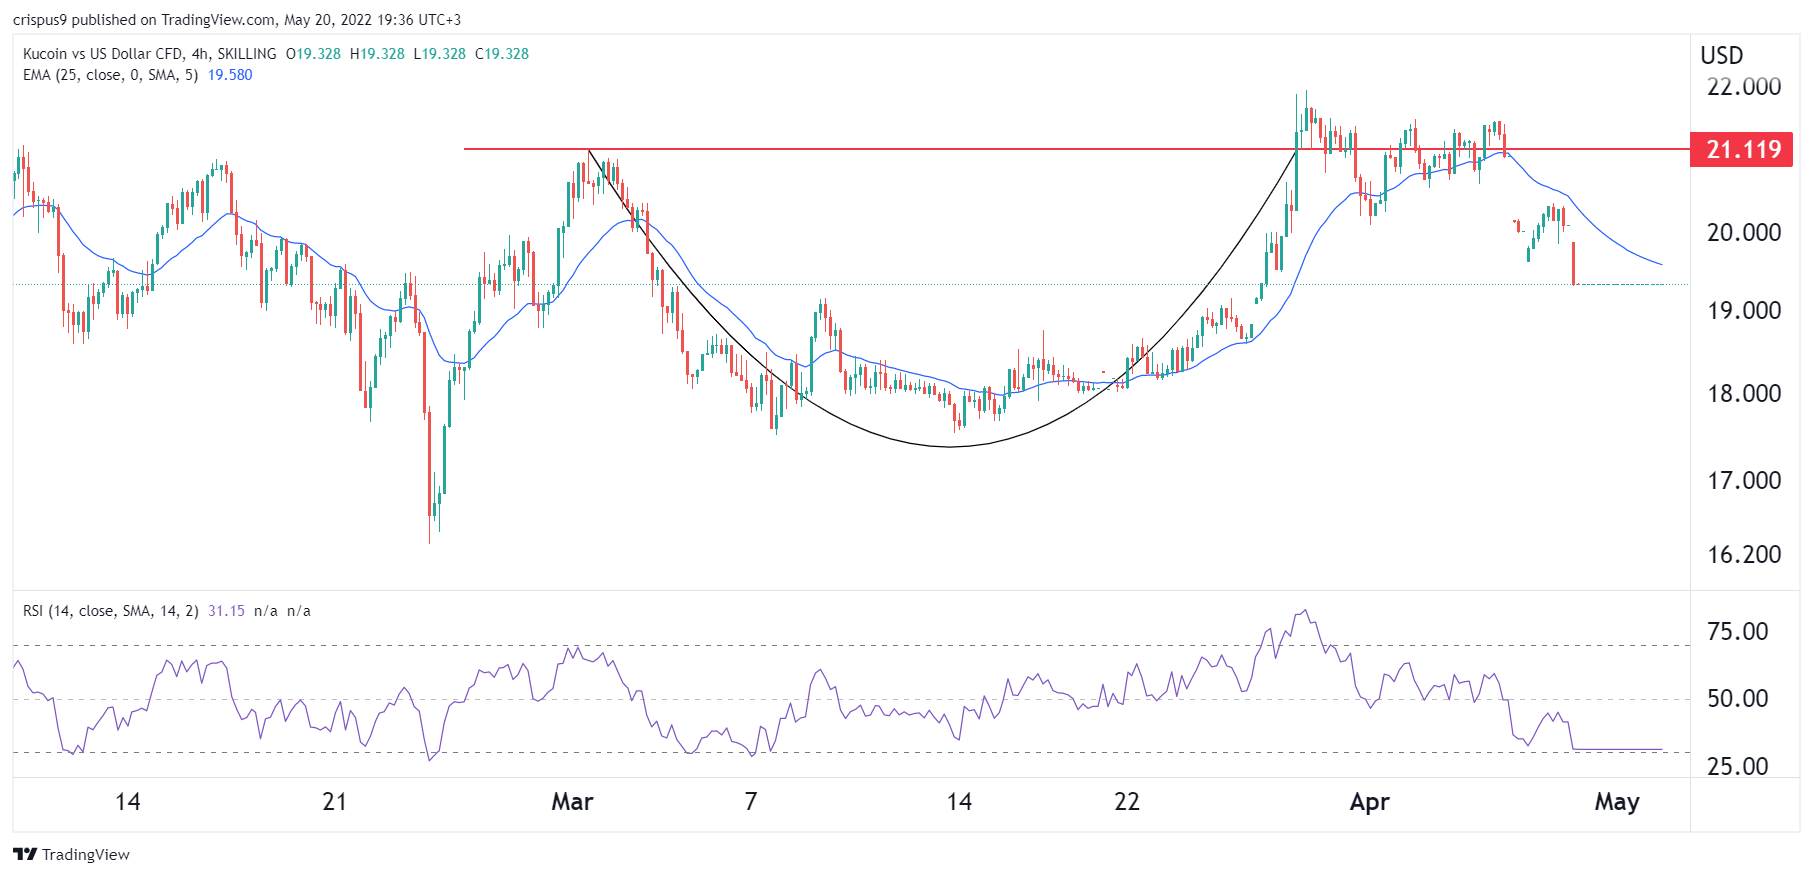
Turning to the four-hour chart, we can see that the price of KCS is different from other cryptocurrency prices. On the four-hour chart, the coin formed a cup and handle pattern shown in black. It has now pulled back and has moved sharply below the upper part of the pattern.
It moved slightly below the 25-day and 50-day moving averages, while the Relative Strength Index moved below oversold levels. Therefore, the selloff is likely to continue as sellers target a key support at $18.


