The bear market of 2022 has been brutal as over $2 trillion in value has been wiped out from the crypto economy. In addition to lost record values, Crypto Winter has managed to break several popular bitcoin price models such as the rainbow price chart and Plan B’s infamous stock-to-flow model. Furthermore, the famous power-law corridor model or logarithmic growth curve chart has also broken out since May 11, 2022, and is below the lower band for about 86 days.
Deviation from the Norm: The 2022 Bitcoin Bear Market Breaks Some of the Most Popular Price Models
For many years, crypto traders have taken advantage of tools, charts and models to predict the future value of Bitcoin (BTC) and other popular digital assets. Bitcoin.com News has written about Plan B’s stock-to-flow (S2F) price model on several occasions, and the S2F model in 2021 was fairly accurate until the end of November.
Additionally, many bitcoiners rely on other charts and price models such as the Golden Ratio Multiplier, Fibonacci Sequence, Rainbow Model and Logarithmic Growth Curves. During the last quarter of 2021, bitcoin traders expected BTC to reach $100K per coin by the end of the year.

In September 2021, when BTC was swapping for prices between $45K and $50K, Will Clemente, principal insight analyst at Blockware Solutions, tweeted about a new price model he called the “illiquid supply floor”. Told. At the time, Clemente said that the model combined Glassnode’s illiquid supply data with Plan B’s S2F model, adding that it created a bitcoin floor price based on real-time scarcity of BTC.
Clemente had an estimated floor value of $39K and the analyst’s illiquid supply floor model collapsed as time went on. Even after divergence from Plan B’s prediction of S2F “worst-case scenario” in late November, the pseudonymous analyst said he was confident the bitcoin price was “still on track toward $100,000.”
None of these bold predictions came to fruition, and in the midst of the start of the crypto bear market, this was the type of price model. openly mocked And condemned by many in the crypto community. The illiquid supply floor was not solid, S2F broke down, and people made fun of the popular “rainbow” price indicator.
I have created a new and improved model for a rainbow chart pic.twitter.com/zgjbqQtOb1
— LevelsDennis.lens (@levelsdennis) June 19, 2022
The popular power-law corridor model has taken a 86-day break from the norm
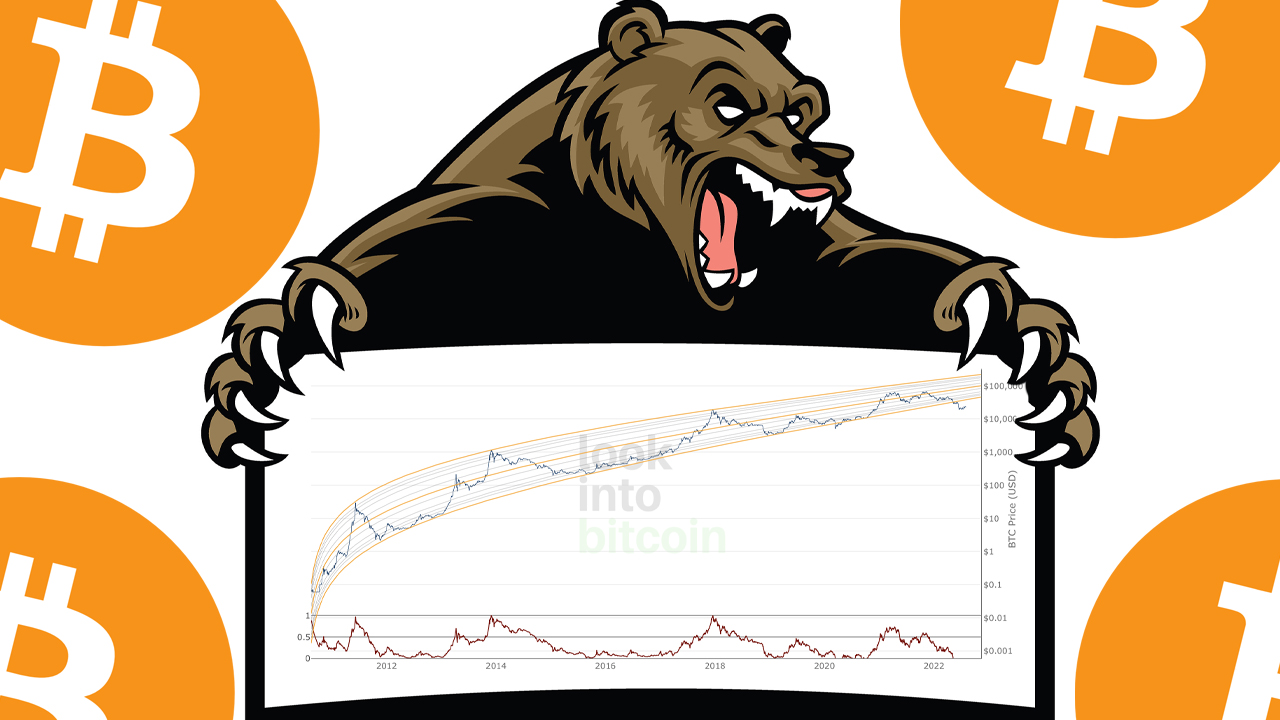
Furthermore, one of the most popular bitcoin price models, known as the power-law corridor model or logarithmic growth curve chart, has also broken out since May 11, 2022. The chart is supported as the price timeline of BTC can be viewed logarithmic. perspective. In fact, the log price chart is one of the most popular in the world of crypto and traditional financial technical analysis.
Bitcoin logarithmic growth curve charts are hosted on crypto web portals such as lookintobitcoin.com and coinglass.com. The current divergence is unusual as the price of BTC has only broken below the lower band twice in its history prior to 2022. The first divergence was an accelerated event in October 2010, and the second most notable divergence occurred on March 11, 2020.

March 11, 2020, otherwise known as ‘Black Thursday’, was an interesting day for every asset on planet Earth as financial markets trembled across the board. At the time, BTC broke below the $4K range and the move fell below the low dev line on the logarithmic growth curve chart.
This specific event did not last very long as global markets rebounded from the initial COVID-19 scare, and a bull market followed almost immediately. The price of bitcoin skyrocketed to the $64K area in April 2021, and above that range to $69K on November 10, 2021.
Nine months later, the price of bitcoin (BTC) is down 66% from an all-time high of $69K, with the popular and often reliable logarithmic growth curve model breaking for 86 consecutive days. While BTC has seen its first bear rally, there is still a way for the price to move back into the lower band of the power-law corridor.
Price Right now For this to happen, the price must be just above the $35K range. The price of bitcoin has never broken below the low band line for so long, and this is unusual given BTC’s 13-year price cycle. The break shows that markets often follow specific mathematical laws, patterns and models, but these types of technical methods are not always accurate.
Currently, the latest bear market rally and other factors indicate that it is quite possible for this specific crypto winter to happen, but as such charts and signals have been broken in the past, this means that no one can really Cannot guarantee the bottom of the market. In.
What do you think about all the bitcoin price models that have been broken in the past? Tell us your thoughts about this topic in the comment section below.
image credit: Shutterstock, Pixabay, WikiCommons, lookintobitcoin.com, Twitter, bitcoinwisdom.io,
Disclaimer: This article is for informational purposes only. It is not a direct offer or solicitation or recommendation or endorsement of an offer to buy or sell any products, services, or companies. Bitcoin.com does not provide investment, tax, legal, or accounting advice. Neither the Company nor the author is responsible, directly or indirectly, for any damage or loss alleged to be caused by or in connection with the use or reliance on any materials, goods or services mentioned in this article.


