
One of the most reliable signals to buy BTC has flashed. The hash ribbon is an indicator based on the health of the bitcoin network, which has historically indicated a large increase. What’s more, in most cases, it has served to mark macro bottoms in BTC price.
In today’s article, BeInCrypto recounts the definition and historical correlation of the Hash Ribbon indicator with the price of bitcoin. Next, we analyze the average movement of the BTC price after the buy signal. Lastly, we look at the characteristics of the latest signal and ask if the $17,592 level will hold.
What is a hash ribbon?
The Hash Ribbon Indicator is based on a fundamental parameter of the health of the bitcoin network – the hash rate. In the simplest terms, the hash rate is the amount of computing power that BTC miners are generating at any given time.
The hash ribbon is set up on the ratio of the hash rate to two simple moving averages (SMAs): the 30-day SMA and the 60-day SMA. indicator was created by Charles Edwards, who explained how it works in a 2019 article. The author called it “the most powerful signal ever to buy bitcoin”.
In addition, Edwards added two more moving averages of bitcoin price: the 10-day and 20-day SMA. According to the author, this allows to increase the accuracy of the indicator and reduces the probability of the price falling from the buy signal to a maximum of -15%.
The process of generating a blue buy signal consists of 3 steps:
- Miners surrender: When the 30-day SMA crosses below the 60-day SMA, the chart turns red.
- end of surrender: 30-day SMA rises above 60-day SMA, green dot lights up, chart turns green.
- BTC price momentum recovery: The 10-day SMA of bitcoin price rises above the 20-day SMA, and the blue “buy” point lights up.
The chart below shows all the examples where the Hash Ribbon’s buy signal has been flashing from the beginning of 2015 to the present day. Also prior to 2015, the signal appeared four times, however, the volatility and gains of BTC price were so great at that time that we will not include them in this analysis.
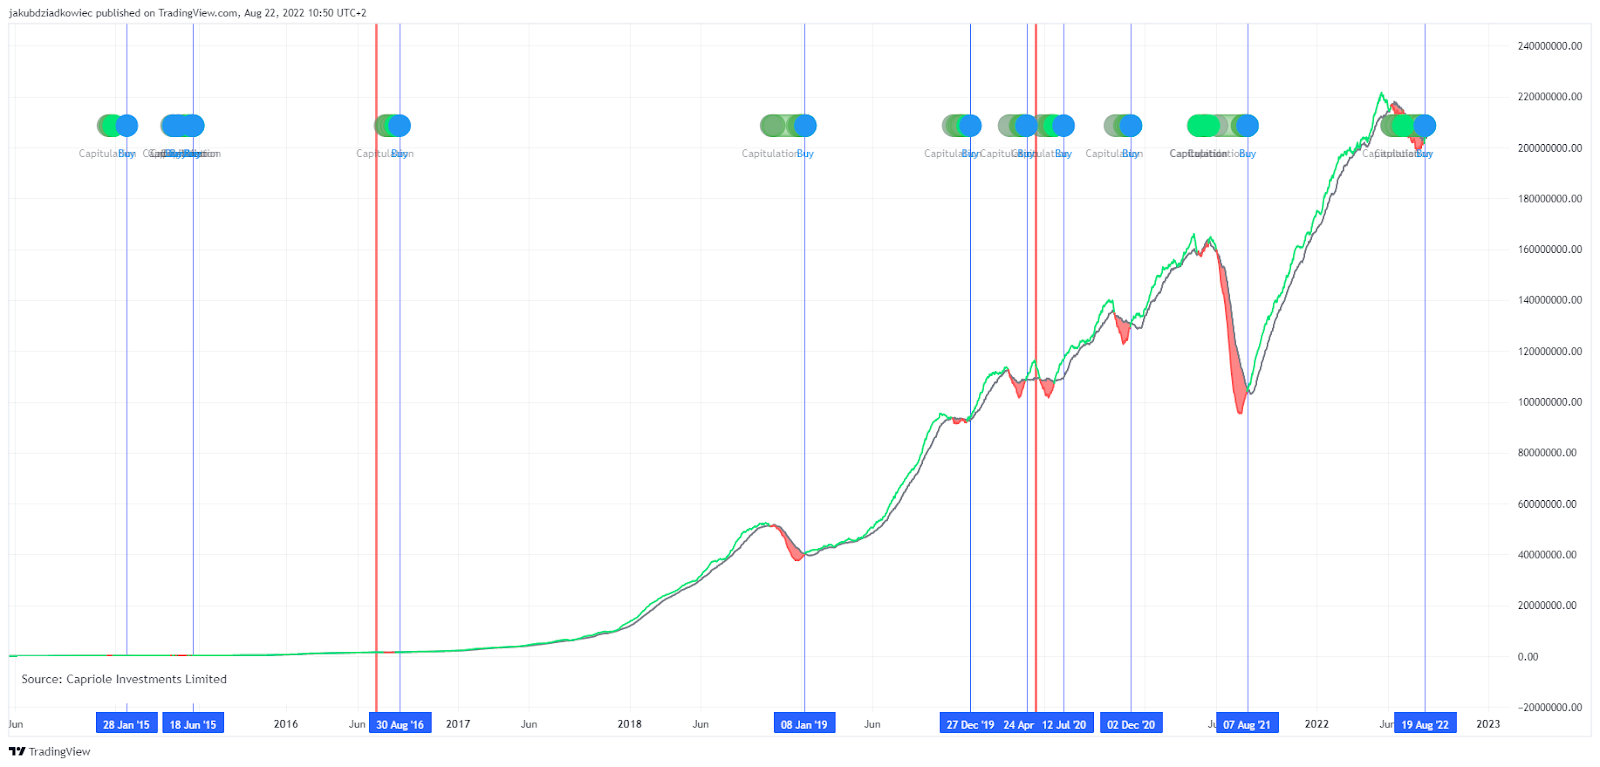
buy signal vs bitcoin price
The basic interpretation of the blue “buy” signal is that the bottom generated by BTC prior to the signal is a historical macro bottom. In other words, the price of bitcoin does not drop below the minimum before the signal from the hash ribbon.
Historical analysis confirms this interpretation, but at the same time there are two exceptions to the rule. In most cases, the bottom before the blue signal was a macro bottom for BTC and the price never dropped below it again (red circles). However, in two cases – from December 2019 and the most recent from August 2021 – this did not happen (orange circles and arrows).
In both cases, bitcoin is down by about 40% from earlier lows, with signals from the hash ribbon failing in the long run. However, this does not mean that there was no increase after the appearance of the blue dot. Conversely, Bitcoin surged immediately after the signal, but the macro bottom later reached below the signal level.
It is worth adding that if the signals from the hash ribbon behave in most cases now, the level below which BTC price should never drop again is the low of $17,592 on June 18, 2022 (green circle).

Hash Ribbon: Average Growth
In the next step, we can calculate the average increase achieved by BTC price from the bottom before the buy signal at the local peak. Taking into account all 9 signals from the Hash Ribbon since 2015, we get an average increase of 614%. Conversely, in the above two cases, the price of BTC dropped by about 40% after falling below the previous bottom, before resuming the uptrend.

The above calculation can also be done in a slightly different way. Instead of measuring from the bottom before the buy signal, you can measure the behavior of BTC price directly from the moment the blue dot appears.
A detailed analysis of this method is given in HonestCrypto’s regularly updated article. The table presented here includes all historical signals from the Hash Ribbon, including those before 2015. Furthermore, any gain is measured as an absolute, rather than a local, peak of a given cycle. Therefore, the growth shown there is extraordinarily high over the historical periods.
In fact, it turns out that the average result of all 14 signals from the hash ribbon gives a maximum increase of 3584%. In contrast, the average risk of a fall is only 10%. Furthermore, the biggest drop occurred after the December 2019 signal and was 45%.

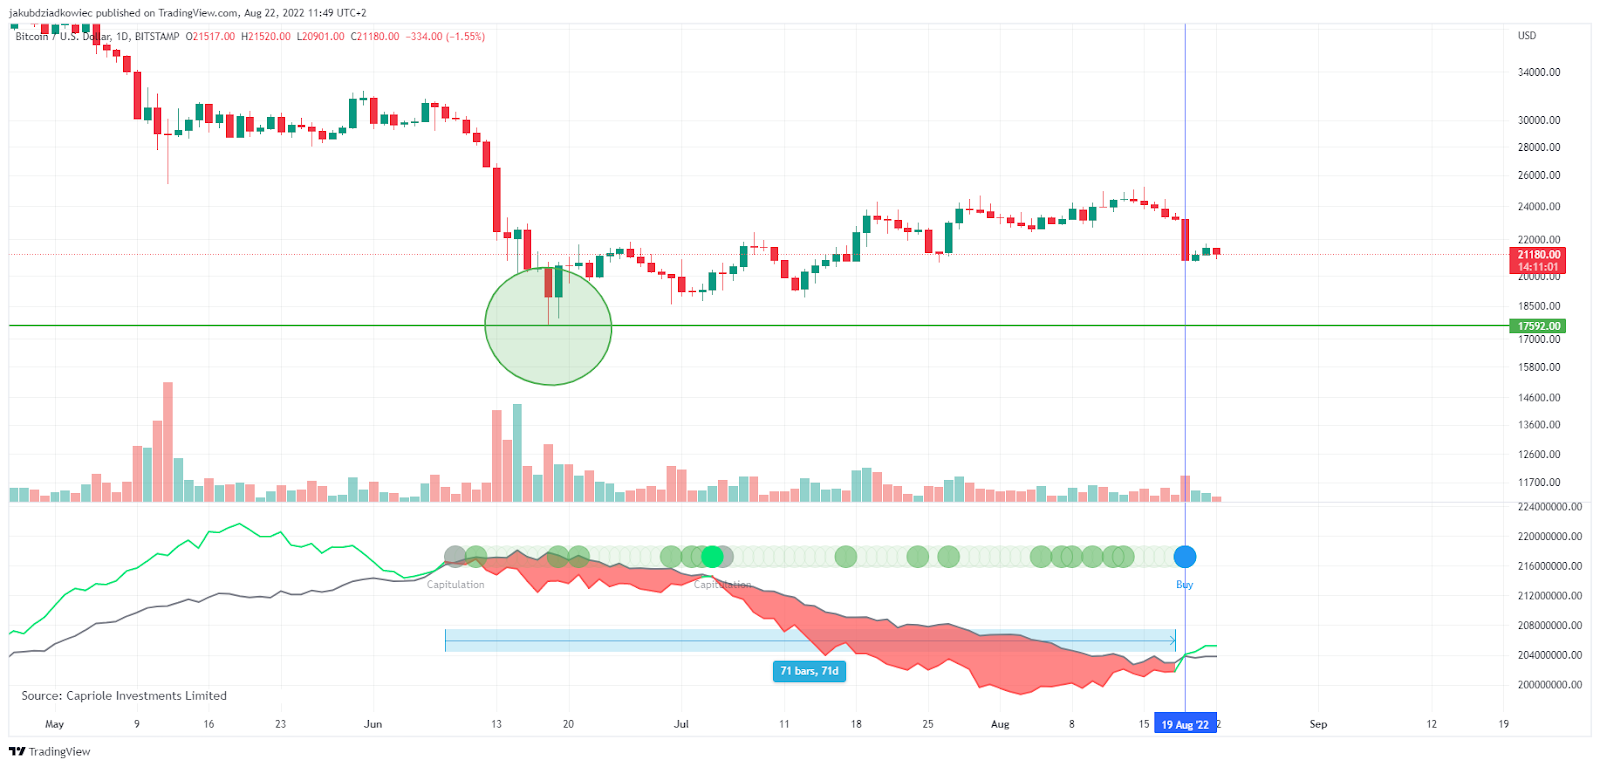
Long Surrender Up and Down $17,592
Finally, it is worth taking a closer look at the latest Signals from Hash Ribbon Indicator, as it has a number of interesting features. First, the miners’ capitulation lasted 71 days before the Blue Signal. This makes it the third longest dedication in history. It started on June 8, 10 days before the low of $17,592 and ended on August 18. The relatively long dedication period was highlighted by Edwards in a recent tweet:
Second, the buy signal occurred on August 19, when Bitcoin recorded a daily drop of 10%, dragging the entire cryptocurrency market down. In order to generate a signal, the 10D SMA of BTC price needs to rise above the 20D SMA. This is quite unusual behavior, as historically the “buy” signal has usually appeared on neutral or upward candles.
And third, the key level is now below $17,592 (green circle and line). If BTC defends this level and the price does not drop below, the hash ribbon signal stands a chance to behave like most historical cases. On the other hand, if it doesn’t, it will be the third case of the Blue signal being ineffective. This, in turn, would call into question the further validity of this indicator.
be for[In]Latest Bitcoin (BTC) Analysis of Crypto, click here,


