
Today’s on-chain analysis summarizes 2021 in the bitcoin (BTC) market, during which high volatility in BTC price was associated with macro consolidation and price action in general. BeInCrypto compares the values of several key on-chain indicators from the beginning and end of the year.
Bitcoin price is up 65.50% year-on-year and is closing in on $48,000. The percentage of supply in profit today is 72.79%. NUPL is at the key support level at 0.49. The amount of BTC in the hands of LTH has increased by 16%. Today the bitcoin network has a hash rate of 168 EH/s and is slightly below its ATH.
btc annual growth
Bitcoin (BTC) started the year with a price tag of $29,000 and closed around $48,000. This gives an annual increase of 65.50% or $19,000.
Meanwhile, the largest cryptocurrency has reached two major peaks (orange). The first was reached at the level of $64,895 on April 14. The second level reached the $69,000 level on November 10 and represents the current all-time high (ATH). So today’s price is 30% less than ATH.

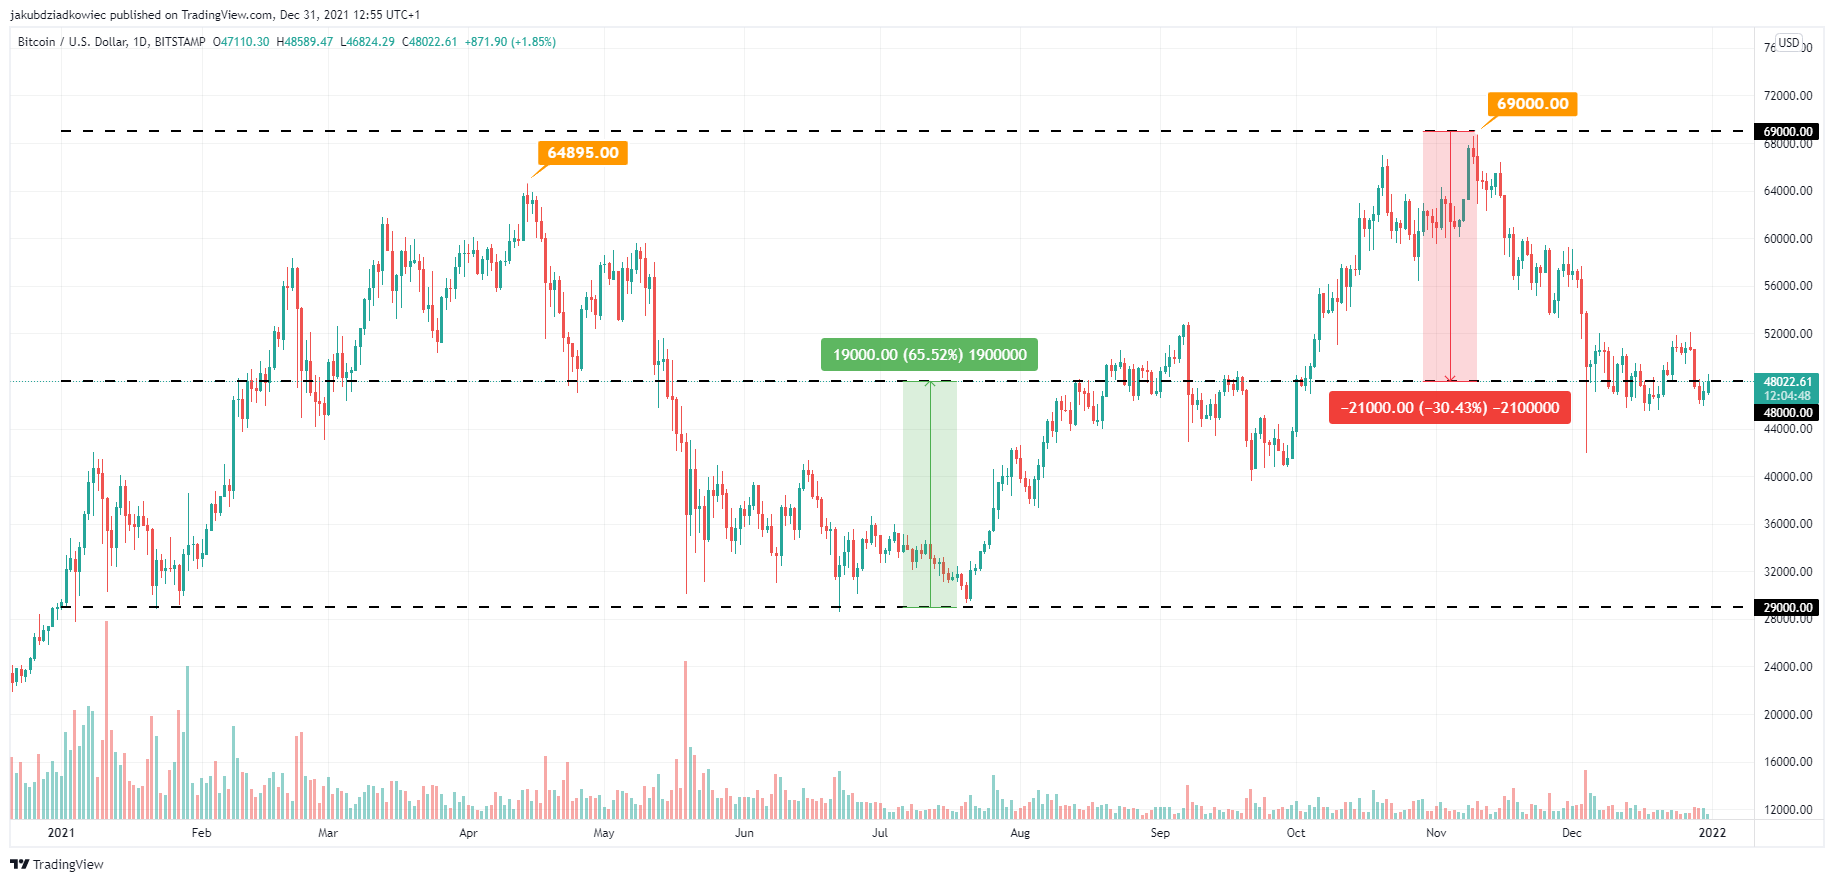
Overall, Bitcoin has been in a major consolidation throughout 2021 in the $29,000 – $69,000 range. It looks like a parallel channel with an average of $49,000. At the same time, the market experienced high volatility as the trading channel shifted from resistance, through the median, to support and vice versa.
Interestingly, the summer macro bottom also reached the $29,000 level during the May-July period, with BTC starting the year. Conversely, the end of the year is very close to the middle of the channel, around $48,000. This indicates a constructive year-long consolidation in which high volatility went hand in hand with sideways price action.
Profit Percentage Supply
Profit Percent Supply is an indicator that measures the number of coins whose price was lower than the current price during the last move. At the beginning of the year, 99.29% of bitcoins in circulation were in profit (blue line) and BTC was priced at $29,000. Values in the 87-100% range remained in place for the first months of the year until the ATH of April was reached.

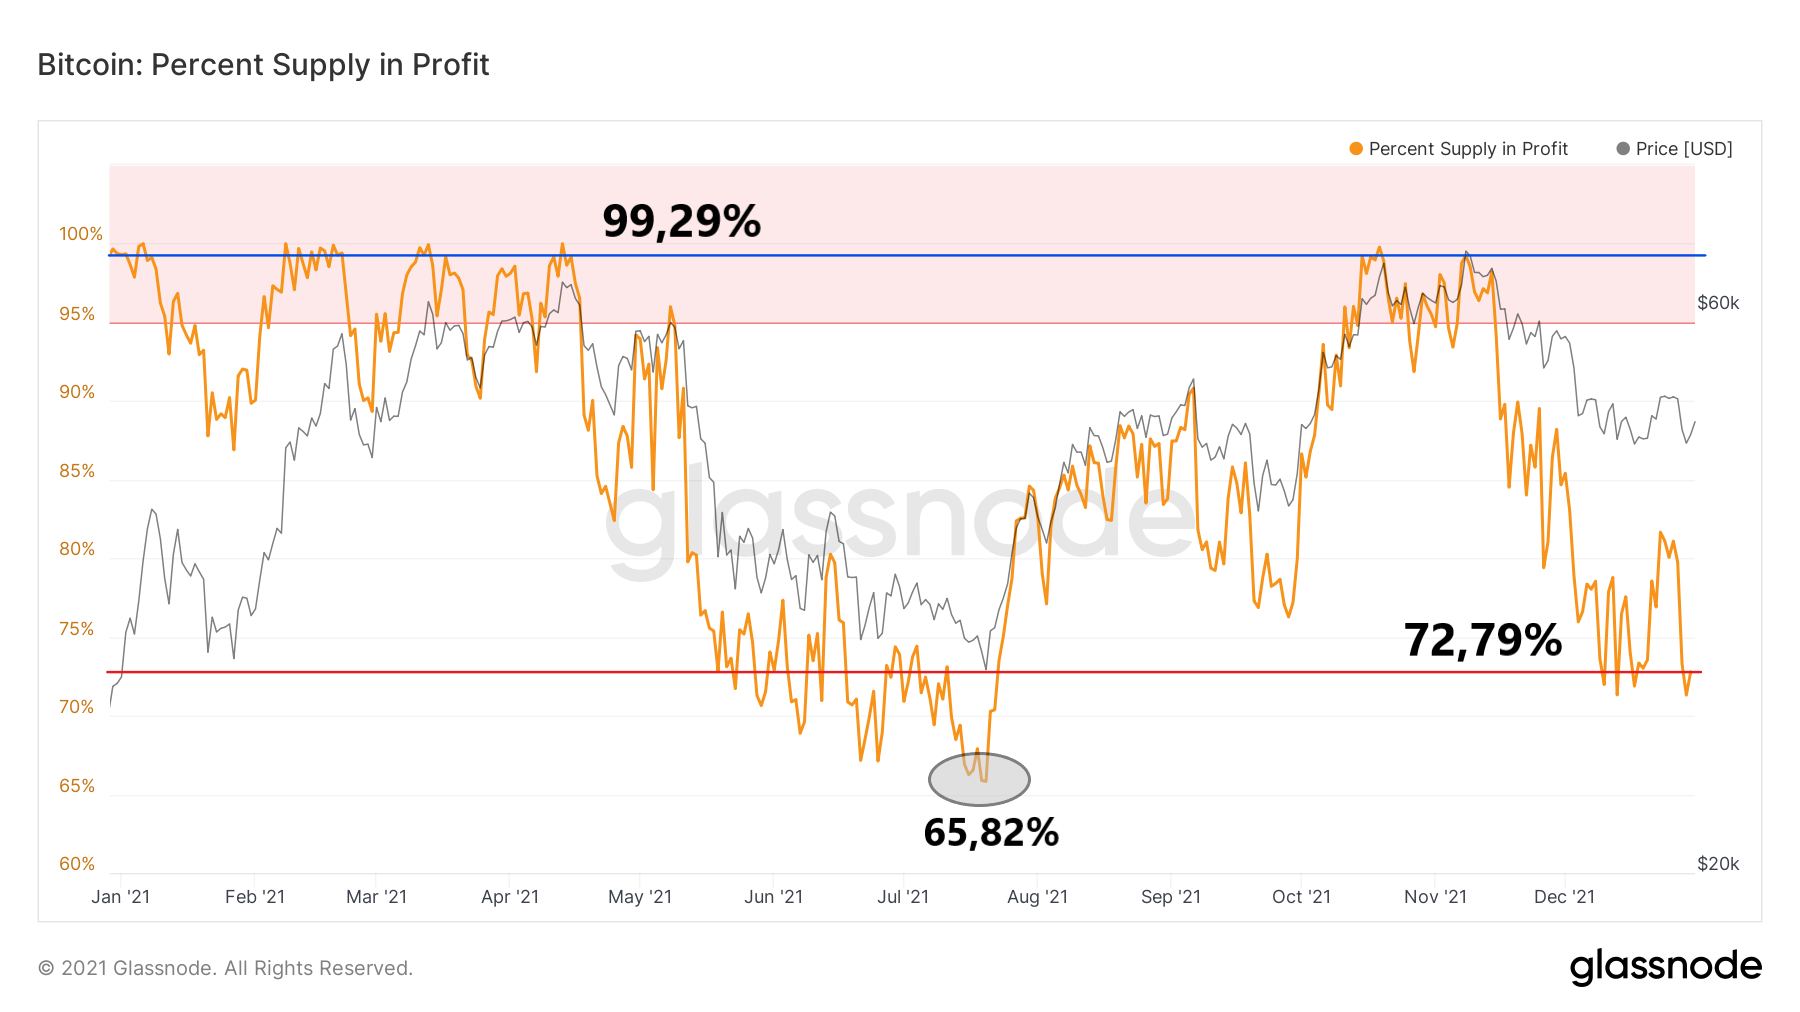
However, the subsequent fall in the price of BTC was followed by a sharp decrease in supply in profit. At the time of hitting summer lows, only 65.82% of bitcoin was in gains (grey area). Moreover, the chart again moved upwards to reach the November ATH near 100%.
Today, 72.79% of the supply is in profit and this is relatively low for the year (red line). Despite BTC price hovering around $48,000, the supply in profit indicator is approaching levels around May-July. Perhaps this is a bullish signal that points to another period of accumulation.
NUPL
Net unrealized profit/loss (NUPL) is the difference between relative unrealized profit and relative unrealized loss. It can also be calculated by subtracting the market capitalization obtained from the market capitalization and then dividing the result by the market capitalization.
The yearly NUPL chart provides an interesting insight into the BTC market and fits into the narrative of long-term consolidation. Firstly, the value of the indicator at the beginning of the year was 0.68 (blue line) and at the end it was 0.49 (red line). For most of the year, the indicator was in the green believe/reject range between 0.5 and 0.75.
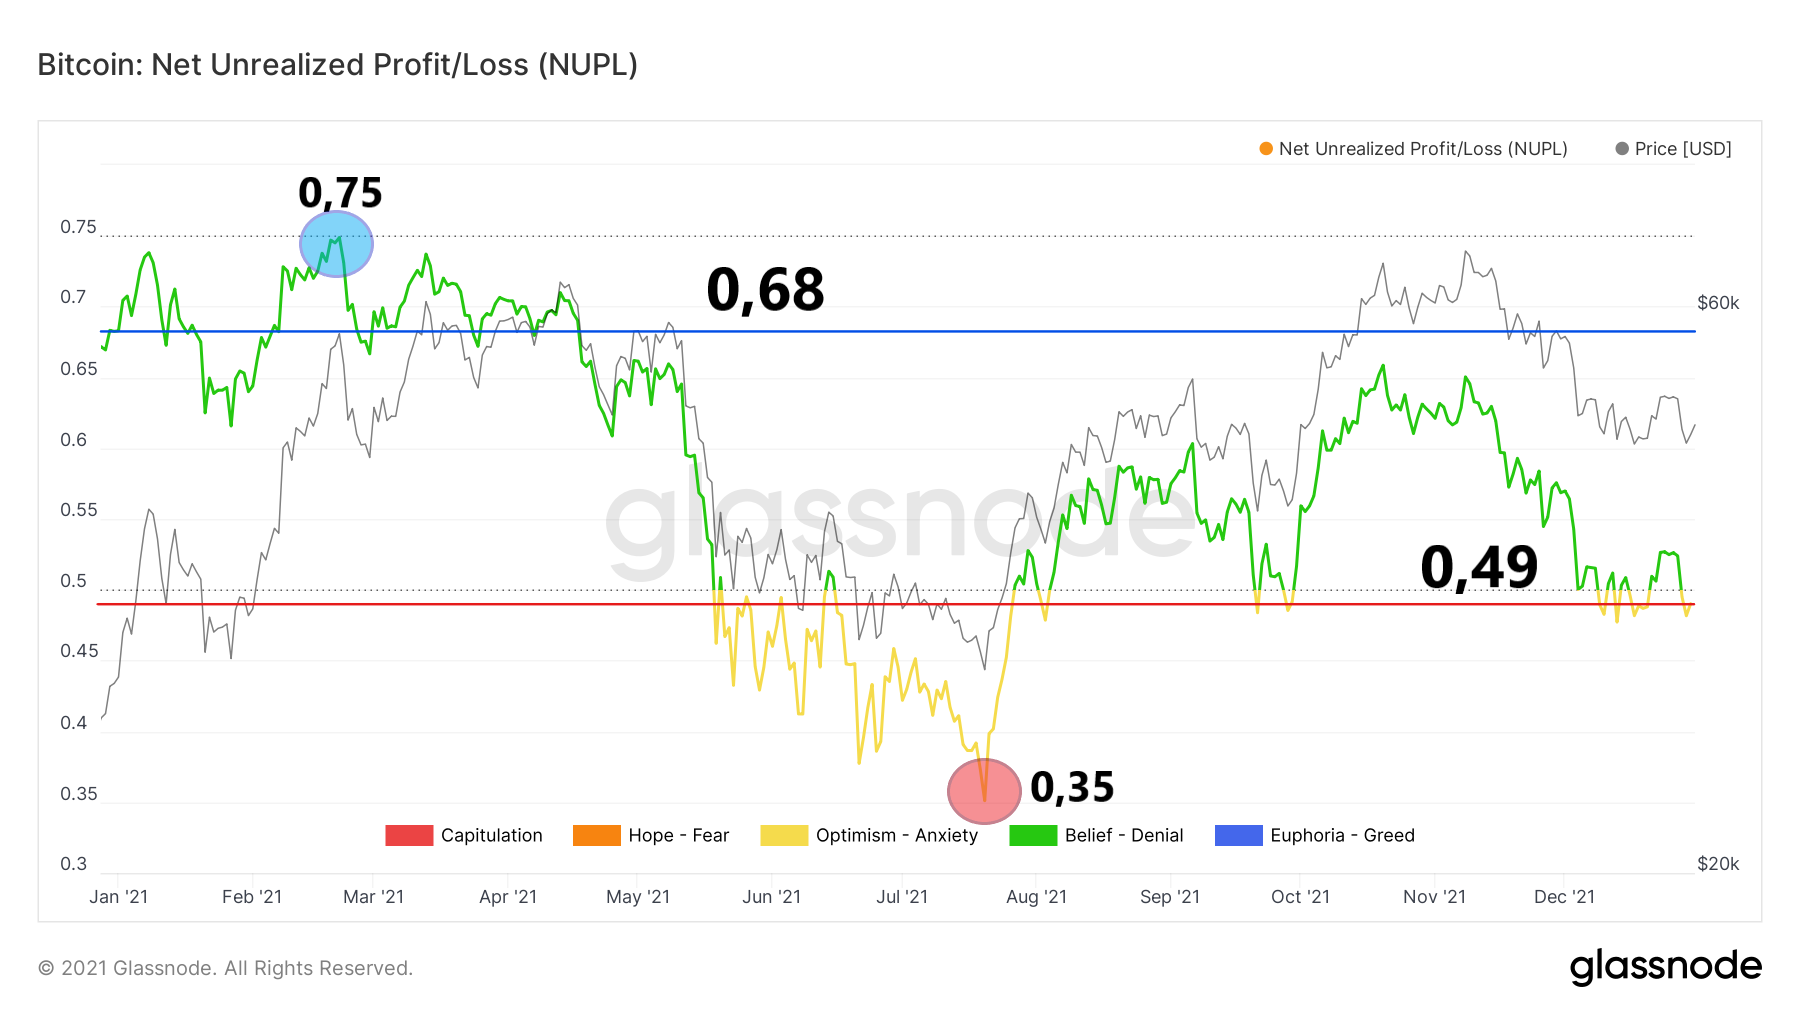
Interestingly, despite the increase in the price of BTC by 65.50%, the value of NUPL is down 0.19. In other words, there has been a huge unrealized loss in the market today despite the bitcoin price being higher than it was at the beginning of the year.
Also, it is worth noting that the annual peak of NUPL was 0.75 on 21 February (blue circle). This number is important because all previous peaks in BTC price coincide with values above 0.75, i.e. in the blue bullish/greed range. So far in this cycle this limit has not been reached.
At the same time, on July 20 (red circle), NUPL had a one-year low of 0.35. This reading remains in the yellow optimism/anxiety zone despite a strong correction in BTC price. At the end of the year, NUPL is pointing to a borderline value of 0.49, where it was last located in September. A potential return to the green area above 0.50 would be an indicator of continuation of the bull market and the maintenance of a bullish long-term consolidation.
BTC Supply Distribution
A recent report from Glassnode has a chart that compares the supply of bitcoin in the hands of long-term and short-term holders (LTH and STH), the amount of BTC on exchanges, and the so-called sovereign supply. The latter is defined as all coins outside the reserves of the exchanges.
As per the chart, the last year brought a change in the ratio of LTH to STH in favor of the former. LTH currently holds 13.33 million BTC, and the supply of those holding the token for more than 155 days is up 16% year-on-year. On the other hand, STH held 3.01 million BTC at the end of the year and their supply is down by 32%.

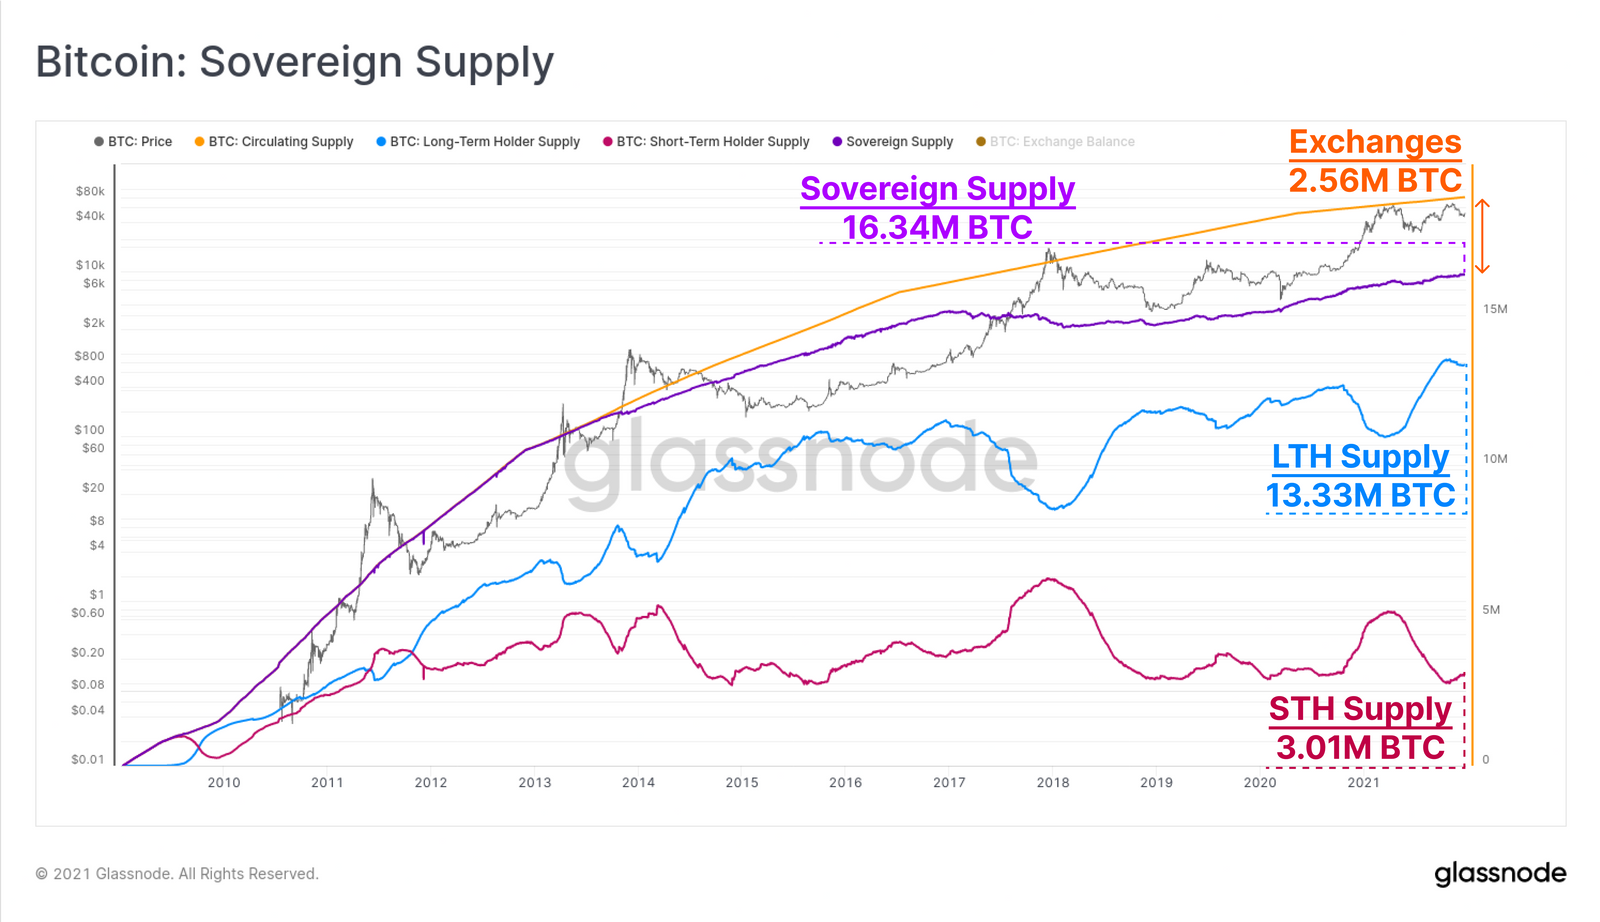
The so-called sovereign supply volume is at a new high of 16.34 million BTC today. In contrast, the exchanges held 2.56 million BTC at the end of the year.
Overall, the shift in supply between LTH and STH suggests that there is a smaller transfer of BTC for long-term holders. This behavior has historically been observed during bear markets, where coins move from weaker hands to stronger hands. The data also fits with our hypothesis of a year-long accumulation and consolidation of the bitcoin price in 2021.
hash rate
The last on-chain indicator to look at in the 2021 summary is the hash rate. It is a fundamental indicator of the health of the bitcoin network, measuring the average number of hashes per second produced by miners.
Like the price of bitcoin, the hash rate closes at a high of 168 EH/s, while it opened on January 1 at a level of 143 EH/s. However, the health of bitcoin’s network experienced the largest ever drop in the hash rate, which occurred between May 13 and July 2, when the hash rate peaked at 84 EH/s (red circle).
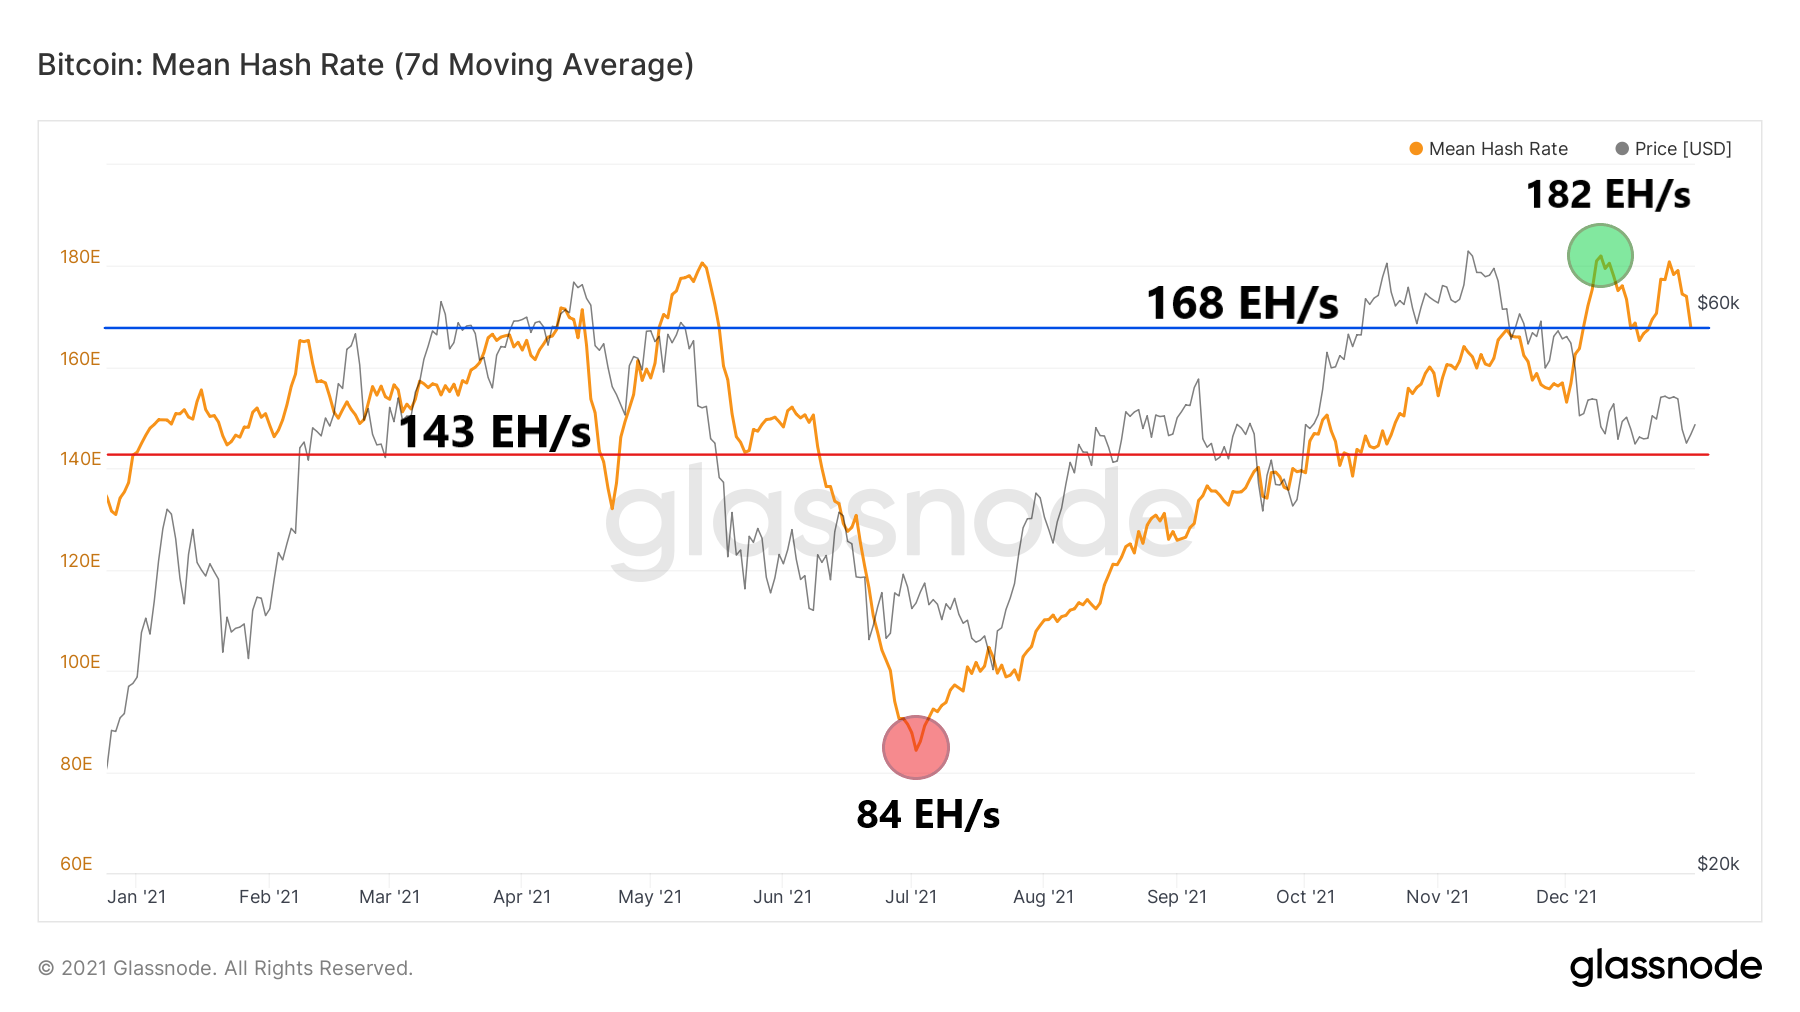
Despite the dramatic events surrounding the mine closures in China, the network quickly recovered its mining capacity. As recently as December, the hash rate reached a new all-time high at 182 EH/s (green circle) and the year closed at 168 EH/s.
This is another on-chain indicator that 2021 was the end of massive growth, reforms and subsequent macro consolidation. Despite this, the bitcoin network is in excellent shape, global decentralization and mining distribution is on the rise, and miners are still interested in BTC mining.
For the latest bitcoin (BTC) analysis from BeInCrypto, click here,


