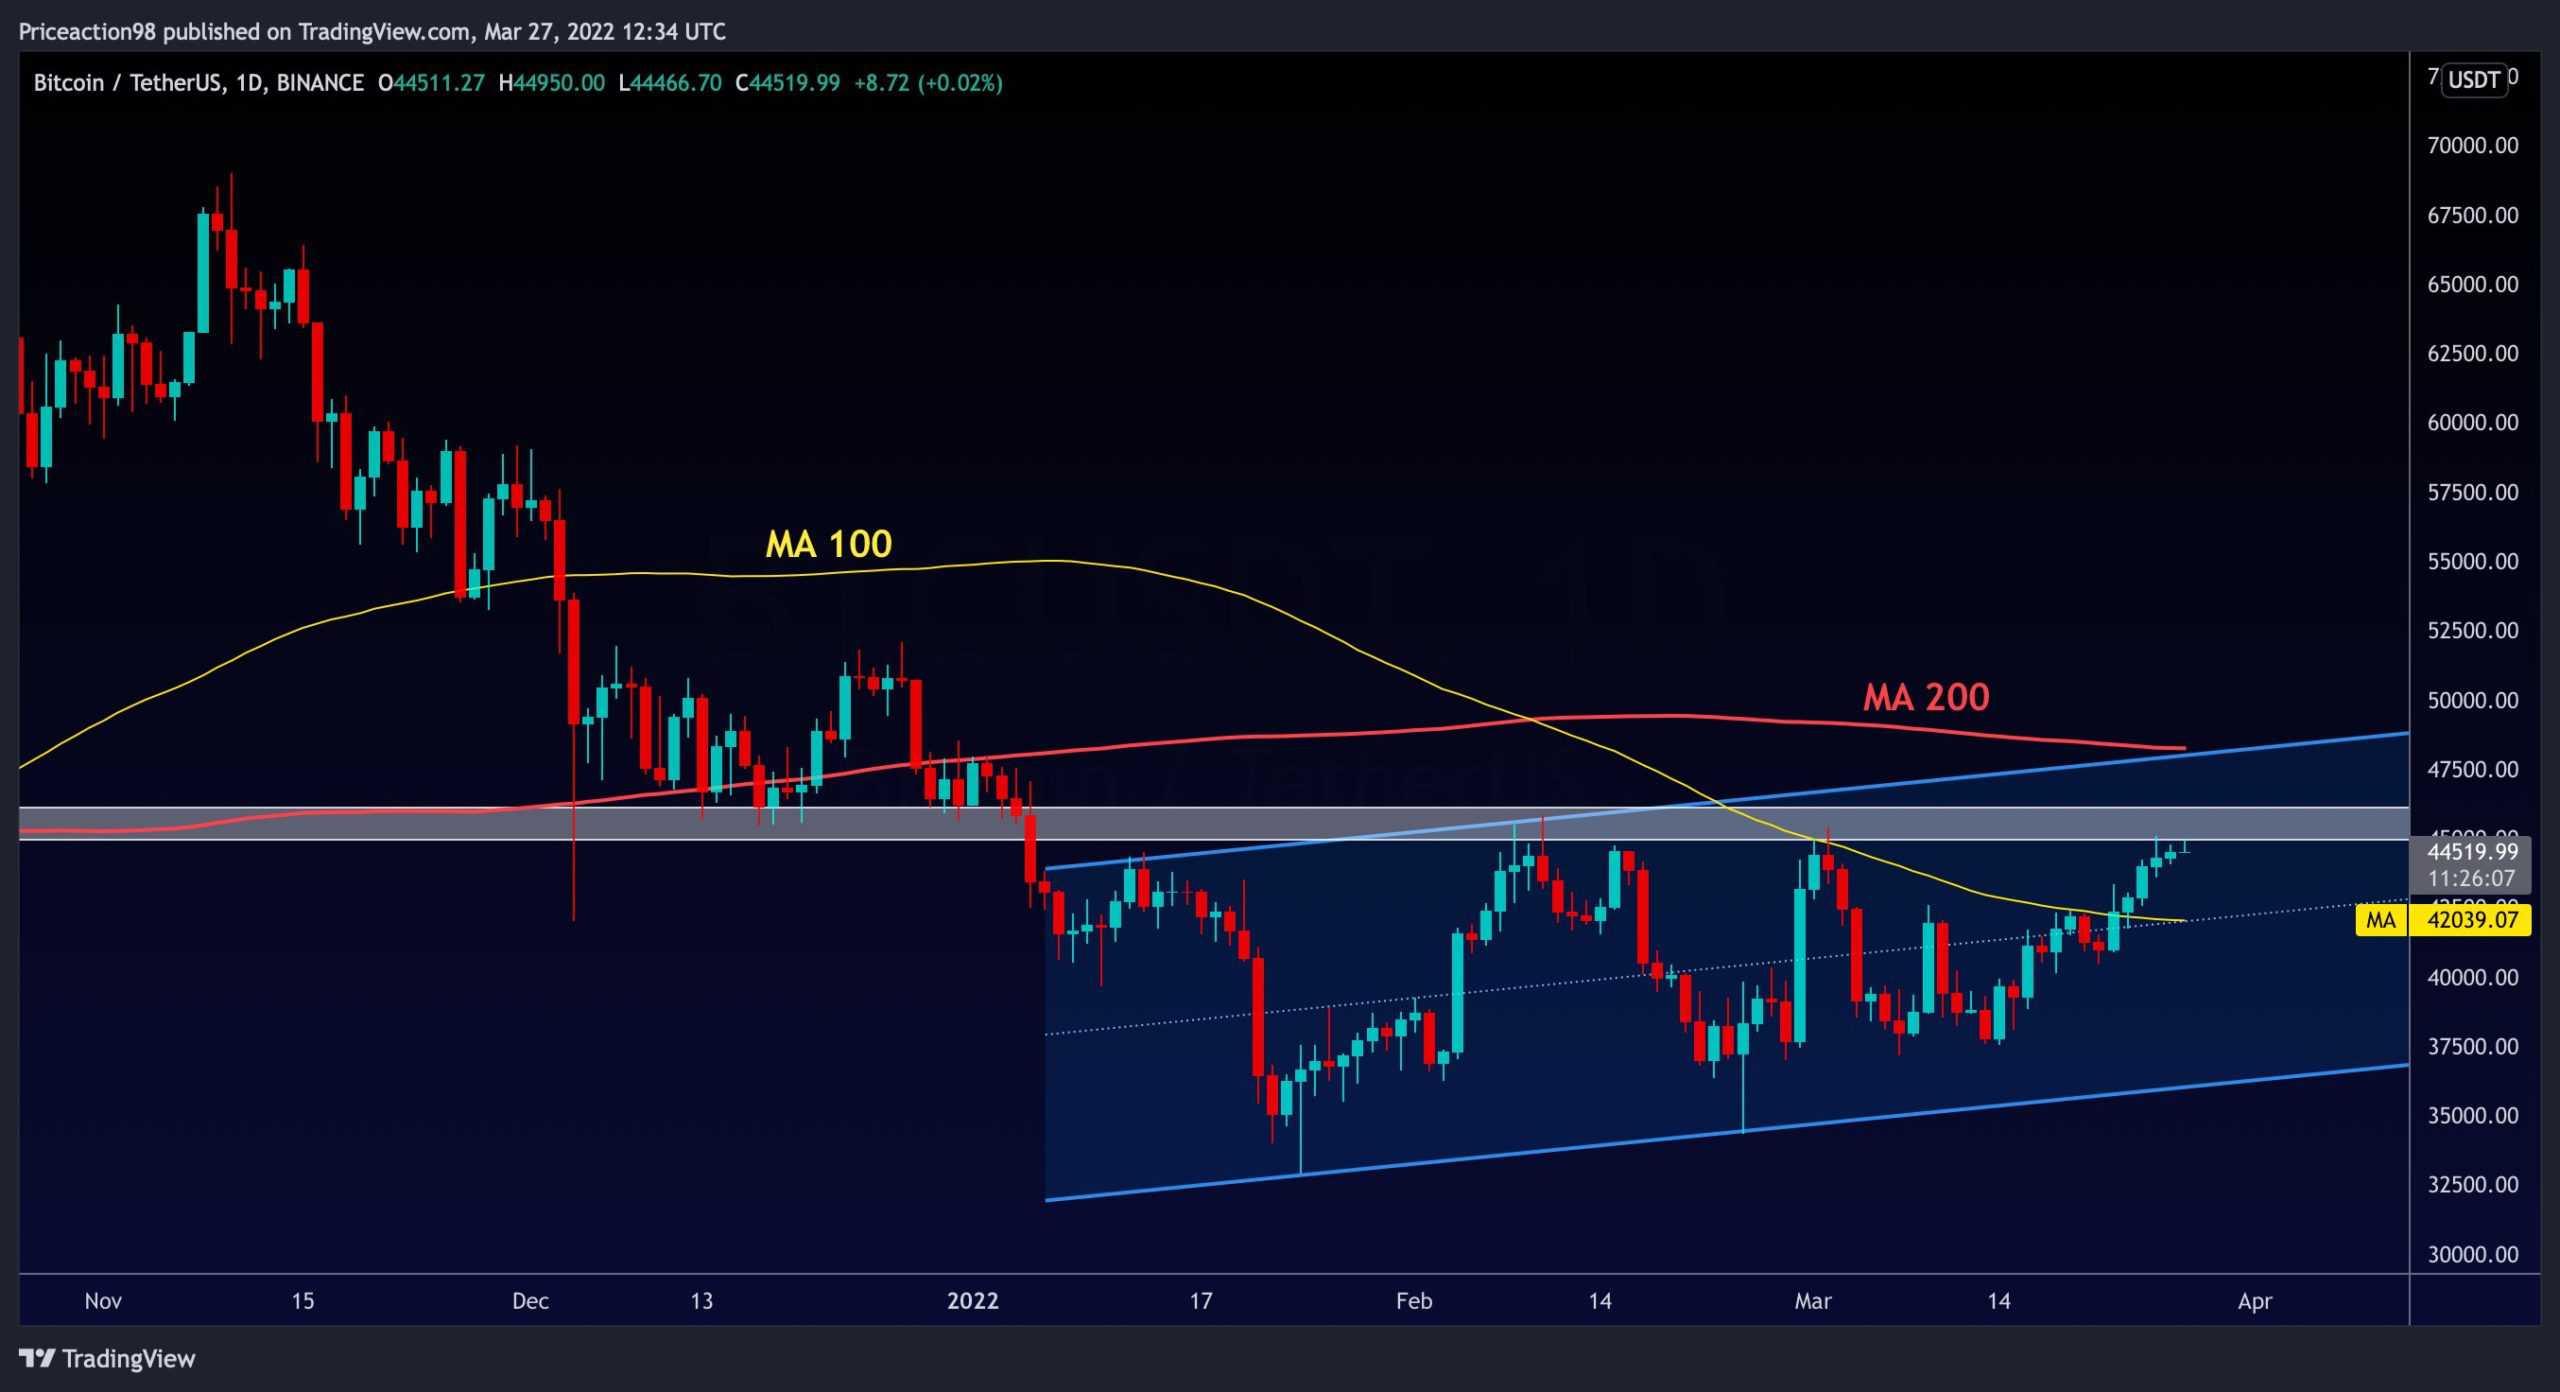
After a sharp rally over the past few days, bitcoin has once again reached the crucial resistance area of $45K.
The good news is that the price broke above the 100-day EMA line followed by a bullish rally from five green daily candles.
daily chart
Technical Analysis By Shayan
BTC price is currently aiming to make another attempt above the crucial $45K resistance level. If successful, a breach above the $46K supply area could be imminent and a possible attempt to retest $50K could result.
Finally, there are two primary resistance levels in the path of bitcoin’s $50K – $60K channel on the higher time frame:
The first one is at the $46K supply area, which is an important resistance area, and the price is currently trying to break it. On the other hand, the 200-day moving average is second – now around $48K. If Bitcoin breaks above the moving average, the reversal is likely to be confirmed, and a new bullish rally will follow.
 4 hour chart
The following chart shows that price is making higher highs and higher lows, which is a strong indicator of a solid bullish recovery based on a price action pattern.
Bitcoin has regained an important resistance level around $45K and its previous peak, raising the possibility of a double top price action pattern emerging. From here, there are two possible scenarios in the short term:
- Bitcoin breaks the $46K resistance level, consolidates as a pullback at the broken level and then resumes its spike towards the 200-day moving average and $50K-$60K channel in the following days.
- Bitcoin breaks above the supply zone, absorbing all of the above liquidity, and then falls into the lower demand/support areas, triggering another round of futures market liquidations. In the lower time frame, the primary support level will be the lower trend line of the yellow trend line and the bearish continuation correction flag.

on-chain analysis
On-chain analysis by Adris
Short Term Holder SOPR (EMA 7)
Bitcoin price recently surged towards $45K, and short-term holders are starting to feel the gains. After three months of sustained losses recovery by short-term holders, this group is back ‘over the water’, and some are using this exit liquidity to exit the market.
Short-term holders are considered market participants who have entered the market in the last 155 days (five months), meaning they have bought bitcoin since its all-time high of $69K in November 2021.
This group mainly consists of traders who bought top and impatient dip buyers who entered the market during the crash, and they have been selling their coins at losses for the past few months, as the price is going down.
However, short-term holders have started to feel the gains after the recent price rally. Considering the price action over the last 155 days, these are the market participants that have registered a decline below $45K over the past few months. These coins coming back into circulation should be met with substantial demand in the coming weeks, or this selling pressure could lead to another drop in the short term.

PrimeXBT Special Offer: Use this link to register and enter code POTATO50 to get up to $7,000 on your deposit.
Disclaimer: The information found on Cryptopotato is that of the cited authors. It does not represent the opinion of Cryptopotato whether to buy, sell or hold any investment. You are advised to do your own research before taking any investment decision. Use the information provided at your own risk. See disclaimer for more details.
Cryptocurrency charts by TradingView.


