
The U.S. dollar appears to be the biggest beneficiary of global financial instability, pervasive inflation, the war in Ukraine and the coming recession.
The dollar has regained currency parity with the euro after 20 years. The European currency is at its weakest almost since its inception. Thus, the U.S. Dollar Index (DXY), or the strength of the USD against the world’s six largest currencies, is today recording 20-year peaks.
Historical analysis shows that a strong dollar has almost always been correlated with a weak Bitcoin (BTC) and bearish sentiment in the entire cryptocurrency market. The situation is no different today, when, with the USD at record highs, Bitcoin is trying to find a bottom near $20,000.
Dollar regains parity with euro
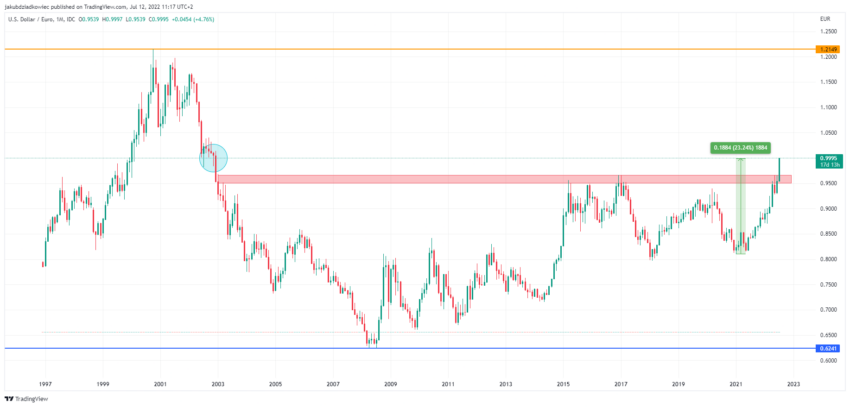
The U.S. dollar rose by 4.75% against the euro in July. Since the Jan 2021 low, it is already up 23% in a year and a half.
The last time parity between the two currencies appeared was at the end of 2002, when the euro began to be introduced into cash circulation (blue circle). Since then, the EUR 0.95-0.96 range has steadily acted as resistance (red) in 2015 and 2017.
This month, however, the U.S. dollar has decisively broken out above this resistance. At the press time, it is priced almost exactly at EUR 1.
DXY breaks out above resistance
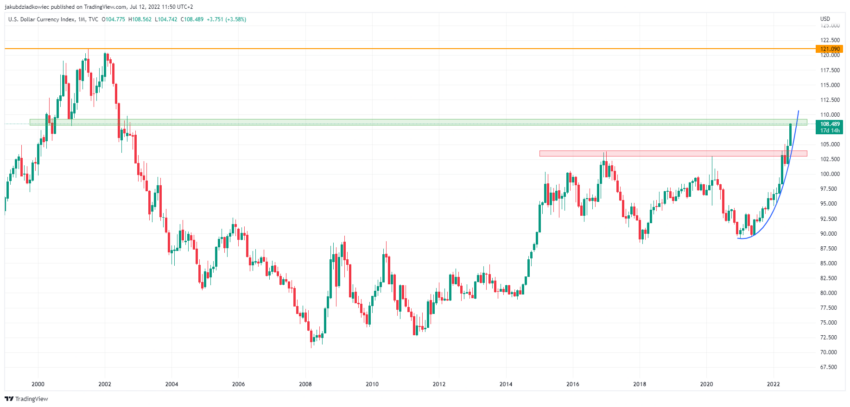
Also, the chart of the U.S. dollar index shows an analogous structure to the USD/EUR pair. The reason for this is that the euro makes up the majority (57.60%) of the basket of the six largest currencies against which the DXY is measured.
Here, the multi-year resistance (red) was in the 103-104 range and was pierced in June. The DXY rate appears to be rising along a parabolic curve with an increasingly sharp slope (blue).
A smaller area of potential resistance is in the 108-109 range (green), the level of the DXY current trading. Should this one be broken through, the next level might not be seen until the July 2001 peak at 121 (orange line).
As long as the U.S. dollar index records a parabolic rise, the cryptocurrency market will remain bearish. Historical analysis shows that successive bull markets on the BTC chart began only during DXY declines.
For Be[in]Crypto’s latest Bitcoin (BTC) analysis, click here.