
Despite a breakout from a long-term ascending support line, Synthetix (SNX) is showing bearish signs in shorter time frames.
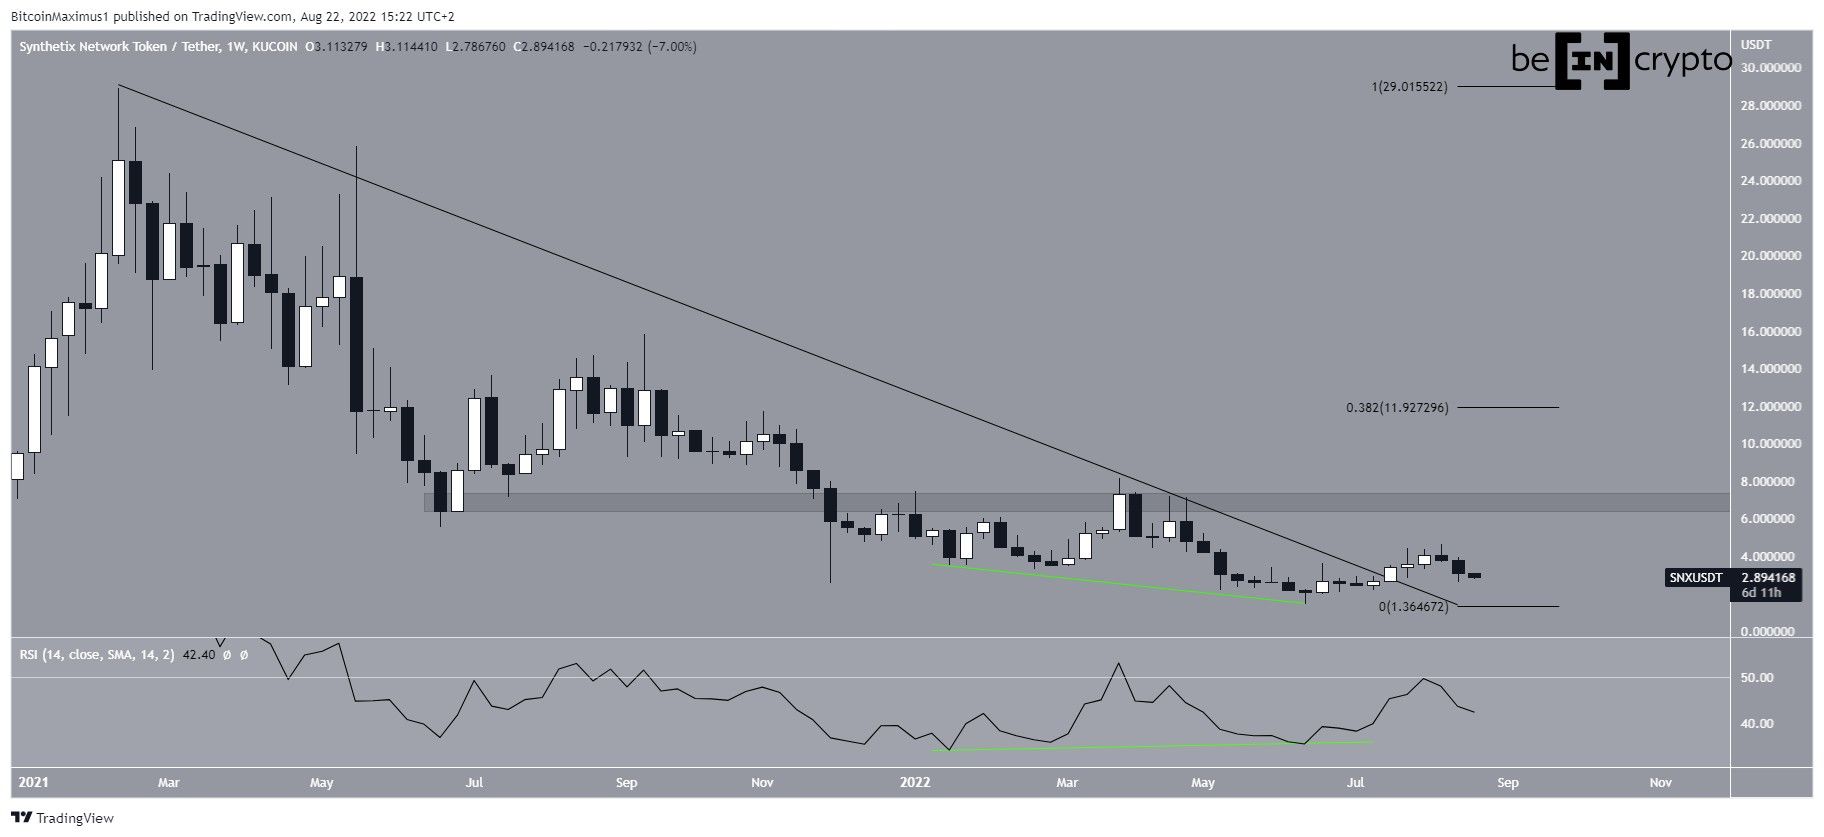
SNX has been falling since reaching an all-time high price of $28.93 in Feb 2021. The downward movement has so far led to a low of $1.42 in June.
The price has been increasing since and broke out from a descending resistance line in July. The breakout was preceded by a very considerable bullish divergence in the weekly RSI (green line).
Prior to the breakout, the line had been in place for 525 days. Breakouts from such long-term structures usually lead to sustained upward movements.
However, SNX failed to sustain its upward movement, only managing to reach a high of $4.64 before falling. Due to this decrease, the weekly RSI also failed to move above the 50 line.
If the upward movement continues, the closest resistance areas would be at $7 and $11.90.
Ongoing SNX breakout
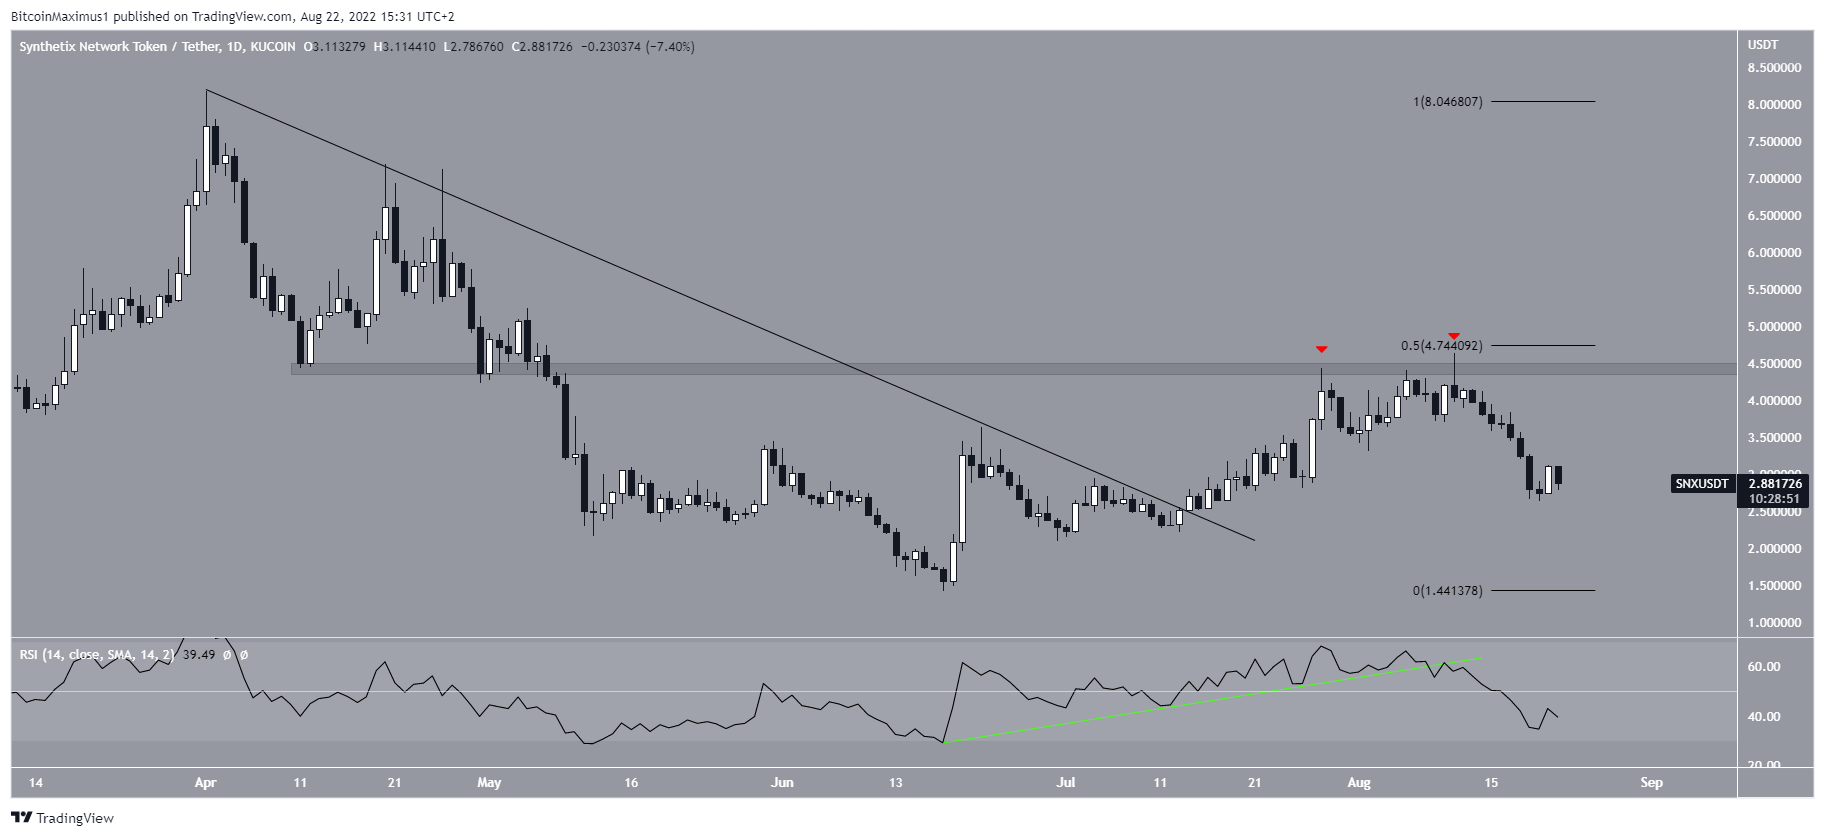
The daily chart shows that the price has also broken out from a short-term descending resistance line. However, it was rejected by the 0.5 Fib retracement support level and $4.50 horizontal area (red icons). It has been falling since Aug 11.
Additionally, the daily RSI has broken down from its ascending support line (green line), something that often precedes price reversals. Moreover, the RSI has now fallen below 50.
So, the daily time frame readings are bearish and suggest that new lows will follow. This is in contrast to the readings from the weekly time frame, which are still relatively bullish.
Short-term movement
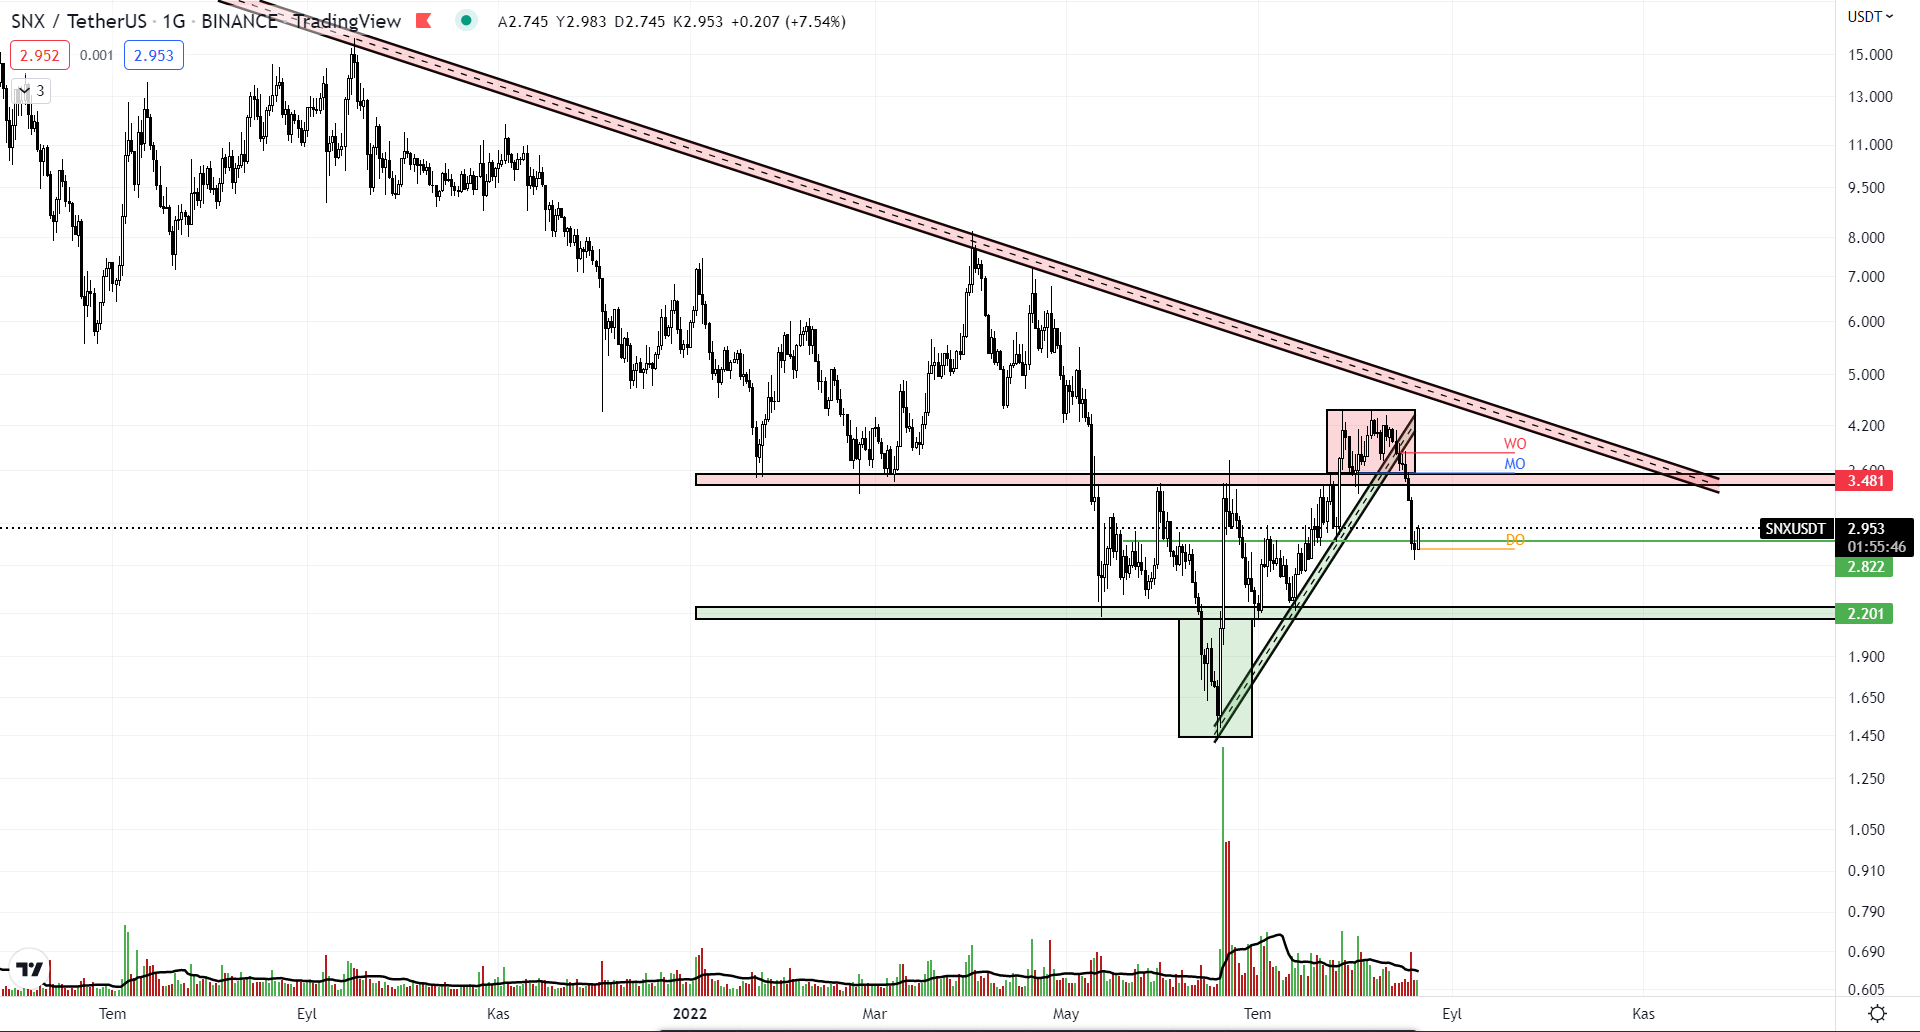
Cryptocurrency trader @AlparslanAntpgl tweeted a chart of SNX, stating that the price has broken down from an ascending support line.
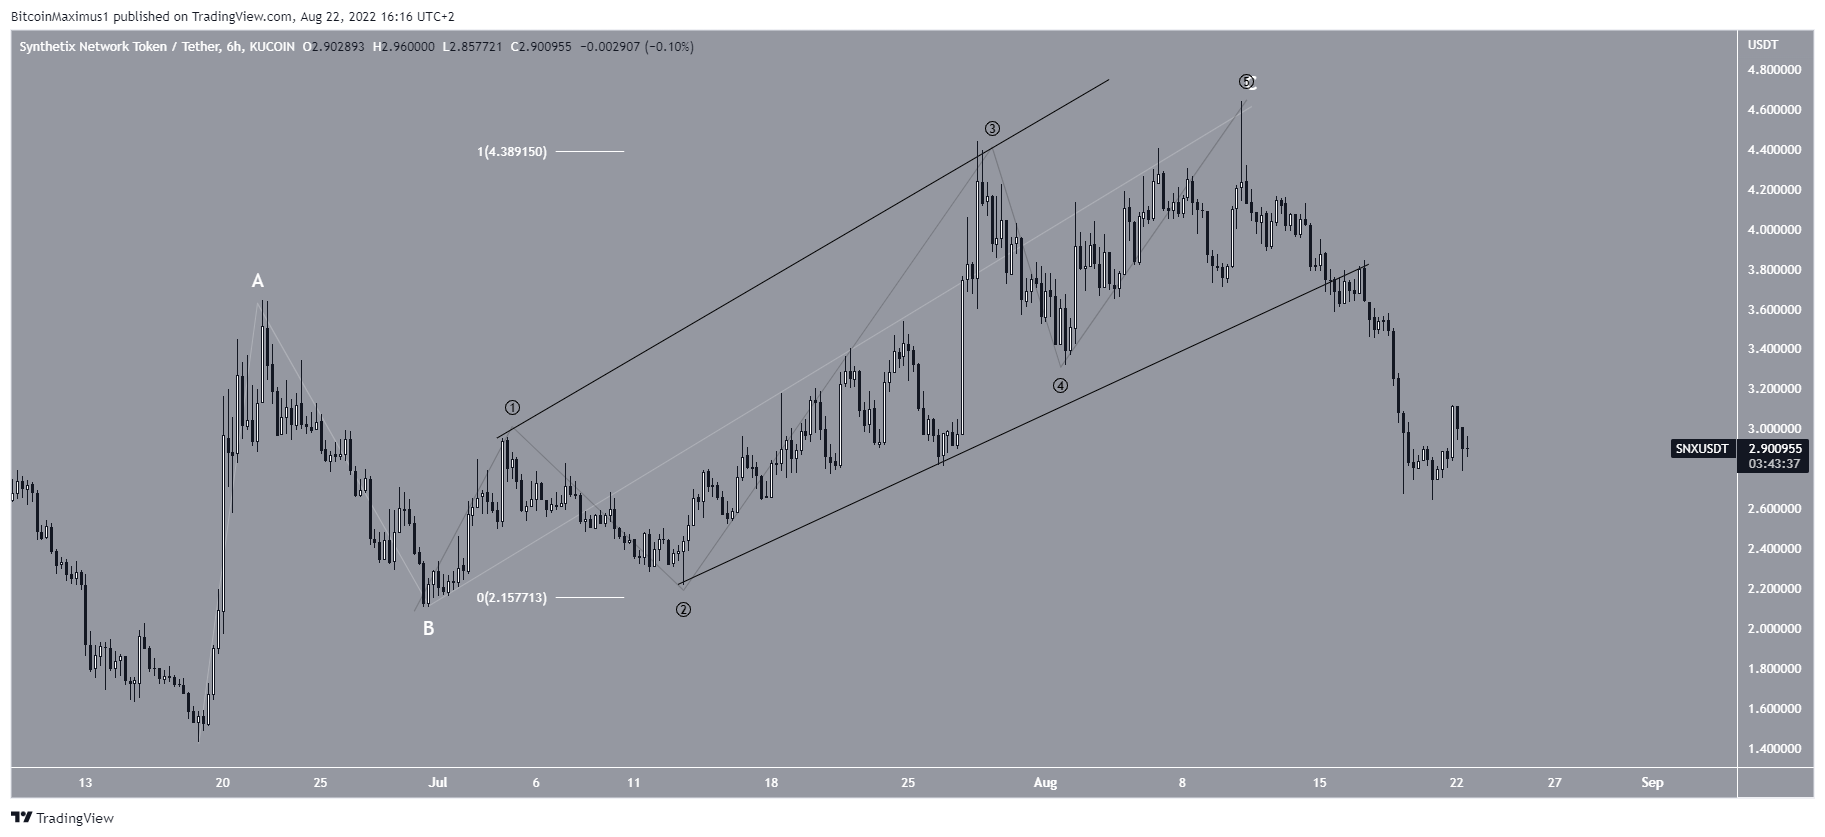
The wave count shows that SNX has completed an A-B-C corrective structure (white), in which waves A:C had a 1:1 ratio. In it, wave C developed into an expanding ending diagonal, hence the shape of an expanding wedge.
If correct, the upward corrective movement is now complete and the price has now begun a new downward movement. So, the short-term readings suggest that the price will decrease towards its June lows and potentially break down.
For Be[in]Crypto’s latest Bitcoin (BTC) analysis, click here