
Synthetix (SNX) has been increasing at a parabolic rate since the beginning of Nov. 2020. It reached an all-time high price of $17.16 on Jan. 16.
Despite the rally, technical indicators show weakness, and SNX is likely nearing the top of the current move.
Parabolic Increase
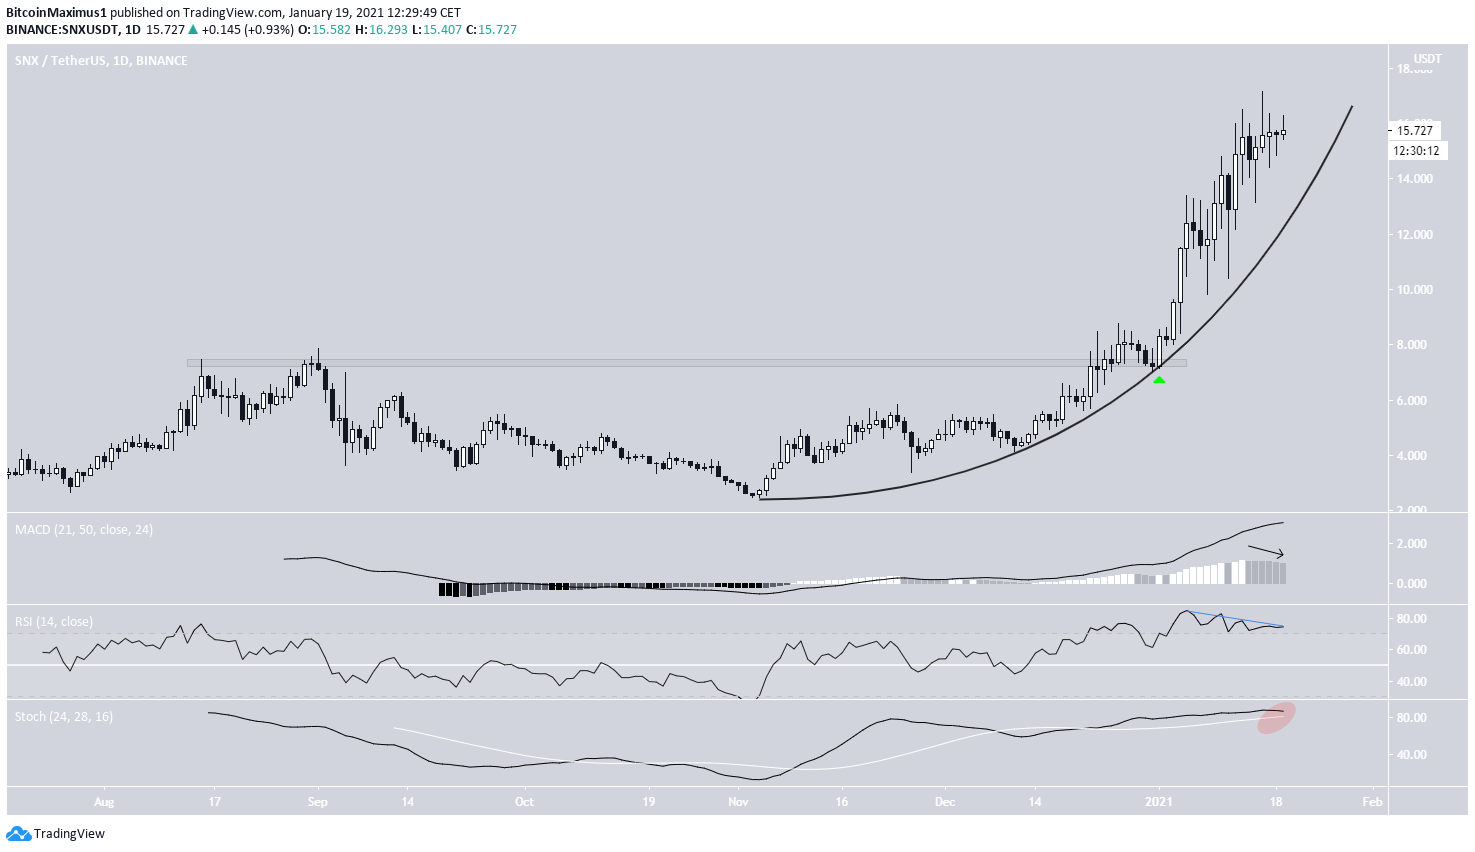
SNX has been moving upwards faster since it first broke out from the $7.40 resistance area and validated it as support on Jan. 1 (shown with the green arrow).
The entire move from the Nov. 2020 lows is parabolic, but the latter portion has an even faster rate of increase. So far, SNX has reached an all-time high price of $17.16 on Jan. 16.
Technical indicators are gradually turning bearish. The RSI has formed bearish divergence, the MACD is falling, and the Stochastic Oscillator is close to making a bearish cross.
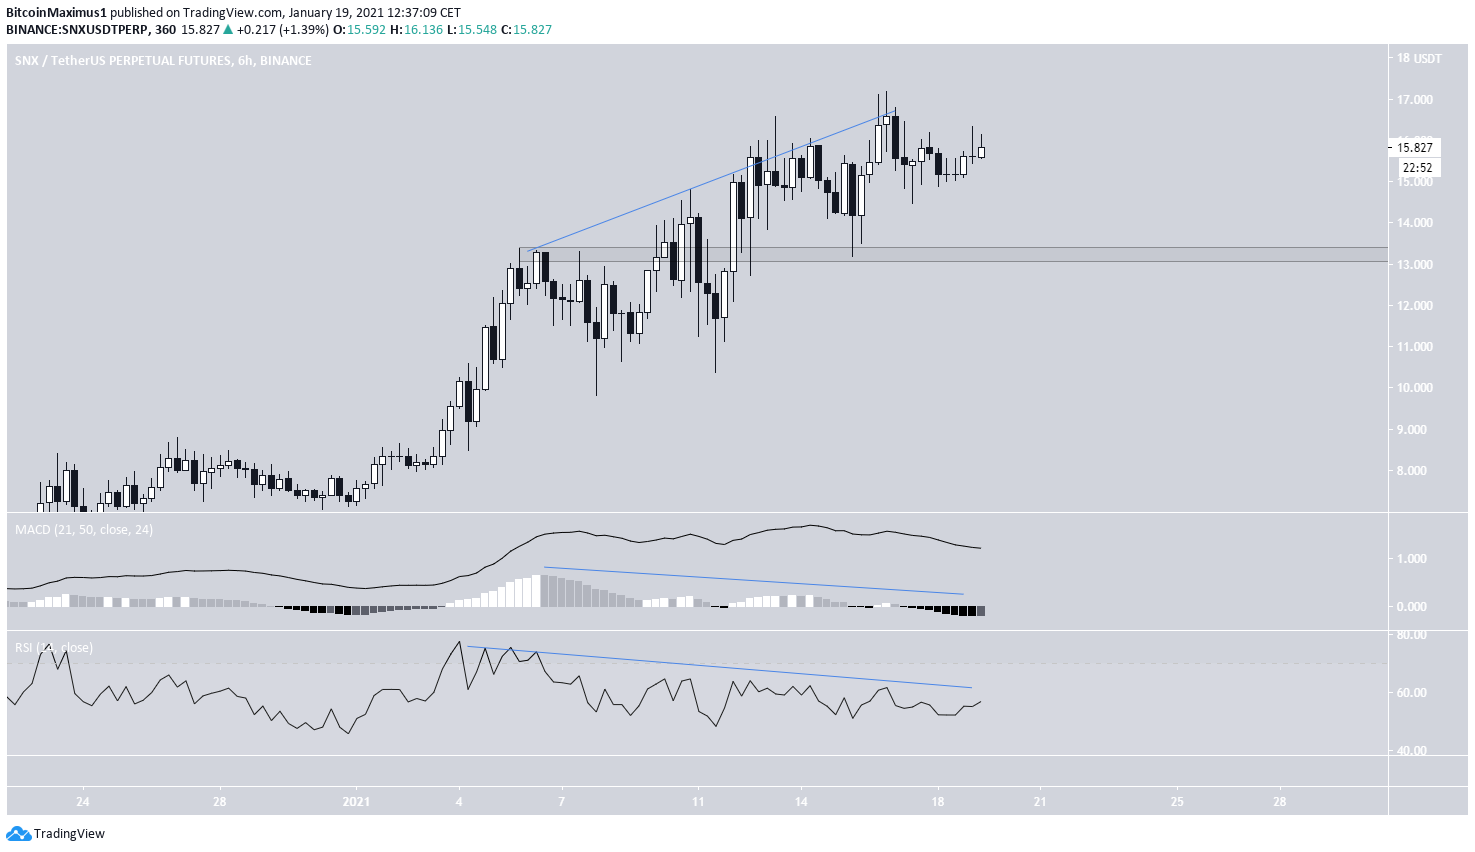
The shorter-term six-hour chart shows an even more pronounced bearish divergence in both the RSI and the MACD. It has been developing since Jan. 4.
Therefore, a drop towards the $13.20 area seems likely, which would also validate the parabolic support line. Currently, we cannot confidently state whether a breakdown will occur.
Wave Count
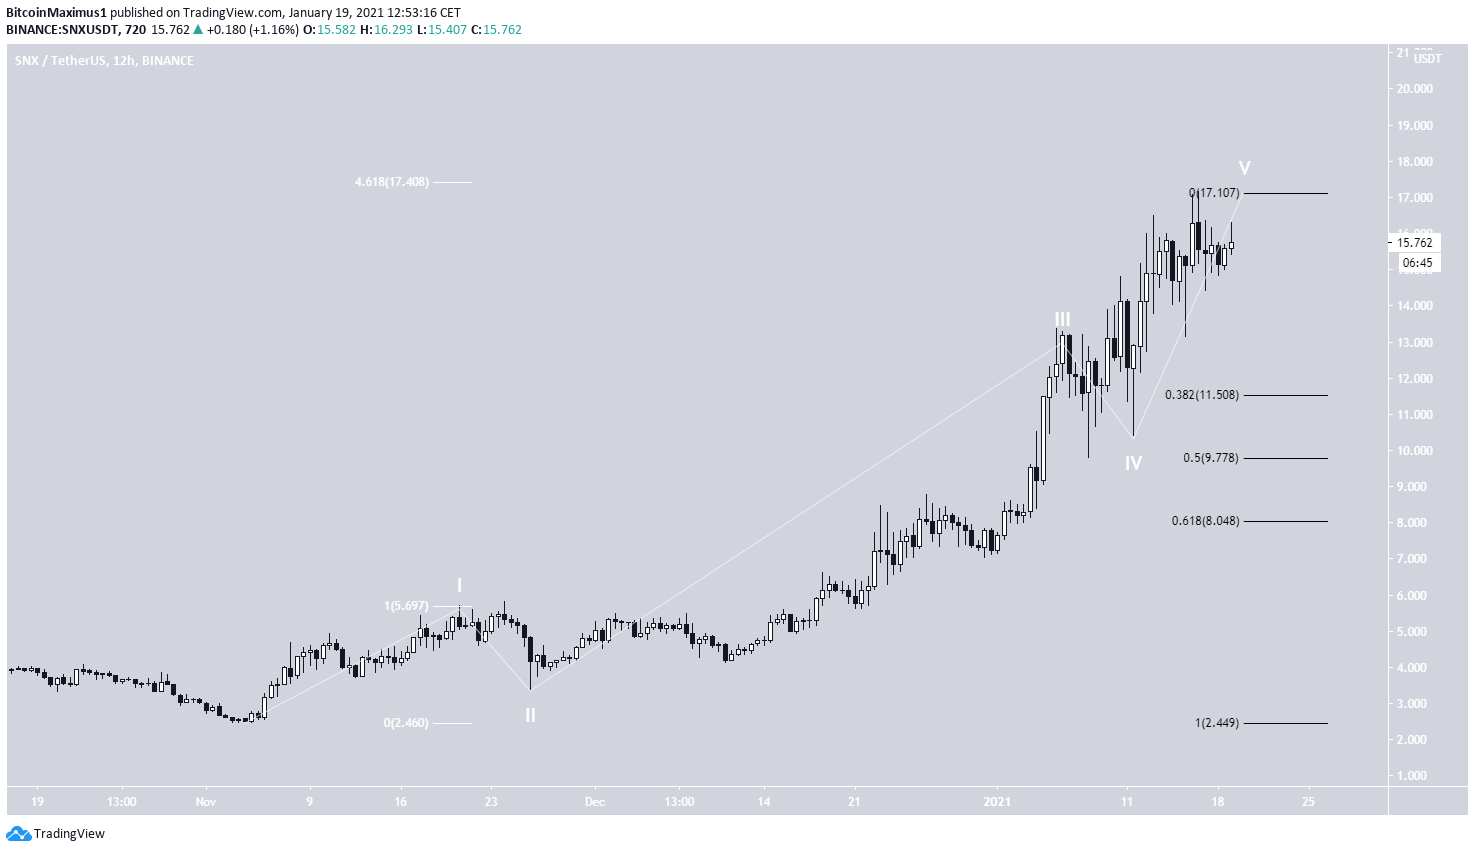
The wave count suggests that SNX is nearing or has already reached the top of a bullish impulse (shown in white) that began on Nov. 2020. It has already reached the 4.61 Fib extension of wave 1, a likely target for the top of wave 5.
While the fifth wave may extend, it does seem like SNX is nearing the top of its upward move, which would also fit with the readings from technical indicators.
If a correction occurs, it could decline at least to $11.50 and possibly $8.05, the 0.382 and 0.618 Fib retracement levels of the entire upward move.
SNX/BTC
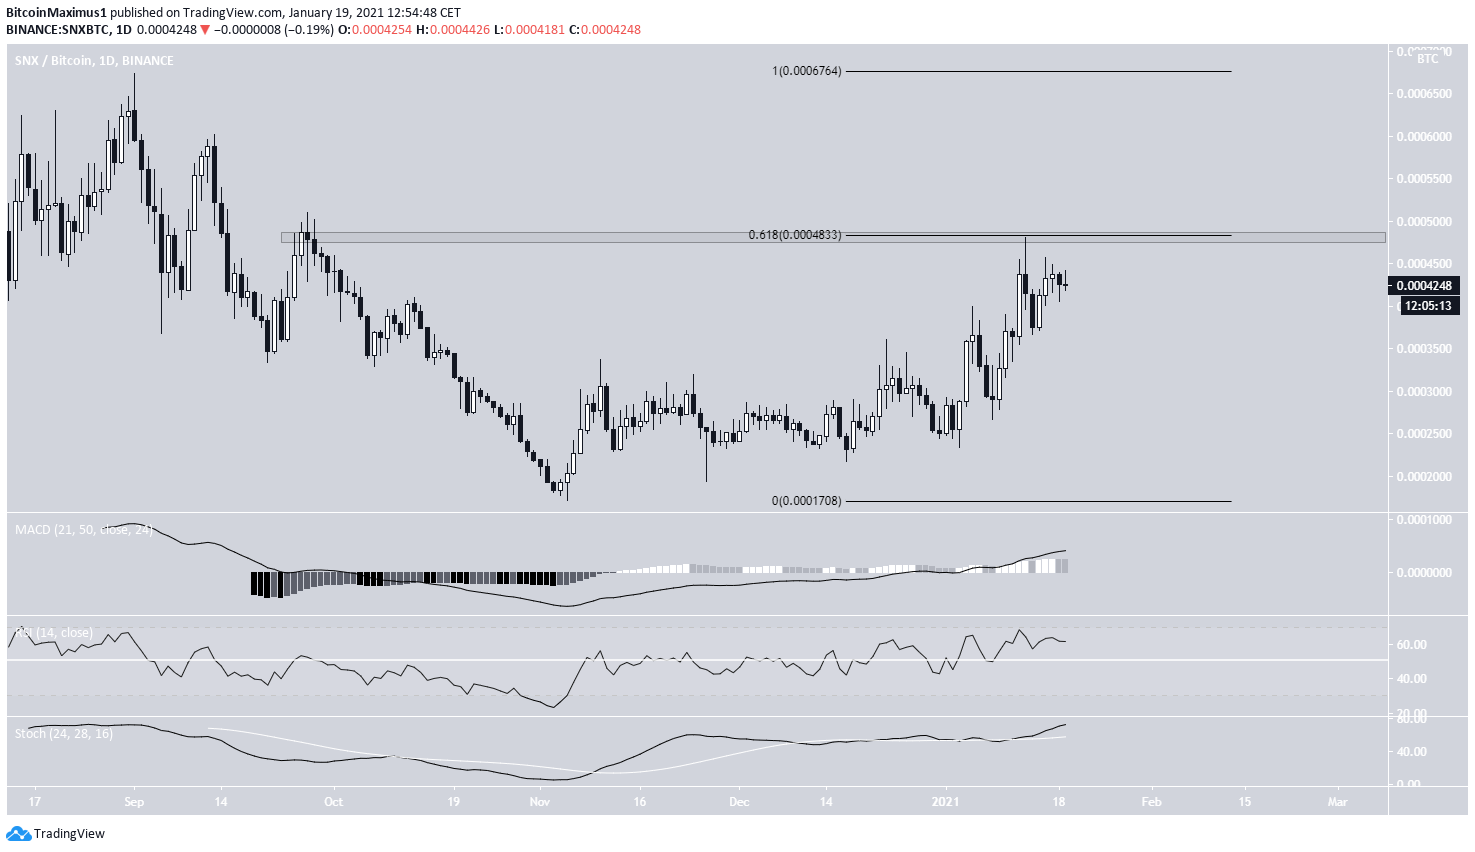
Cryptocurrency trader @Trader_XO outlined an SNX chart, which shows the price gradually moving upwards.
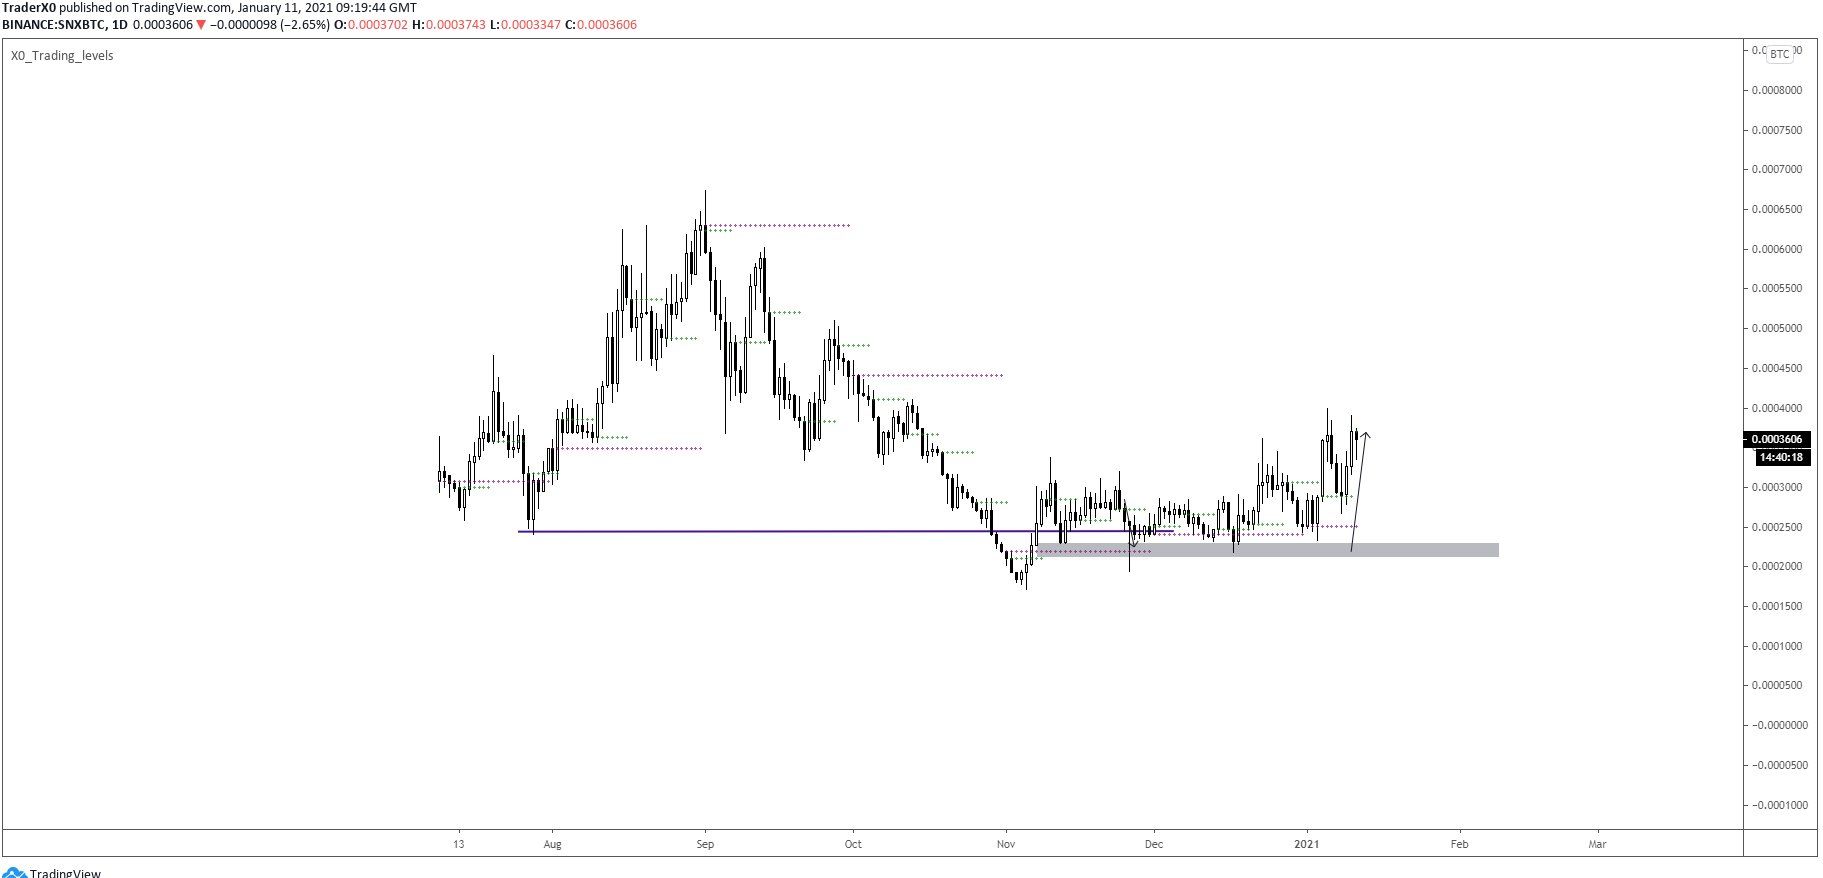
While SNX has rallied, it has been rejected at the 48,330 satoshi area, the 0.618 Fib retracement of the entire downward move.
Even though technical indicators are bullish, a bullish trend cannot be considered until SNX reclaims the 48,330 level. Doing so would pave the way for an attempt at the all-time highs at 67,640.
Conclusion
To conclude, SNX is likely nearing the top of an upward move that has been going on since Nov. 2020. The beginning of a correction is likely at this level.
For BeInCrypto’s latest Bitcoin (BTC) analysis, click here!