
BTC has been correcting for nearly a year, more specifically since the April 14, 2021, high. It is possible that this correction has now come to an end.
Long-term BTC correction
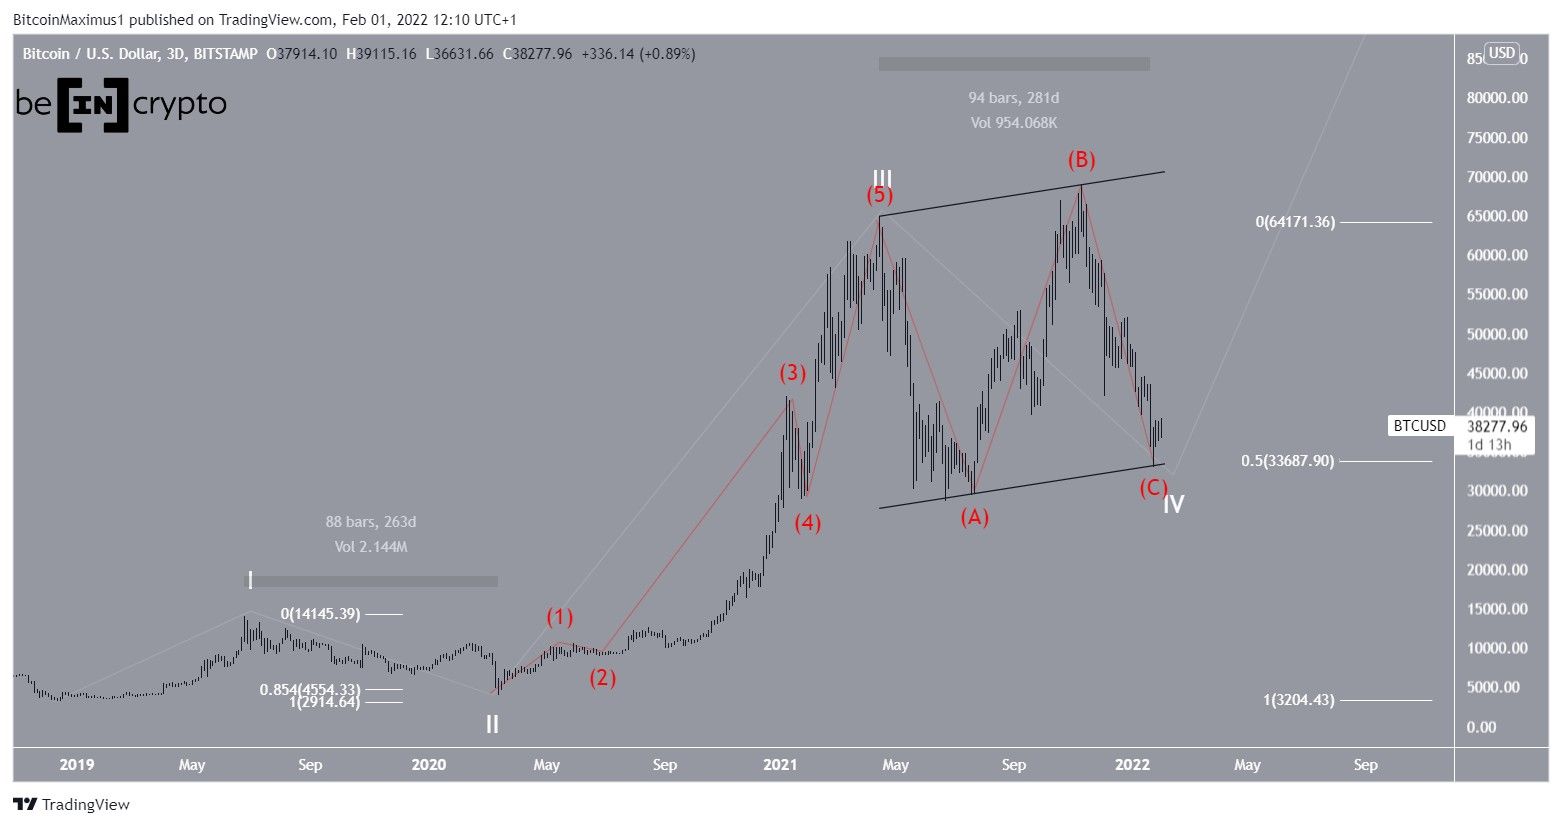
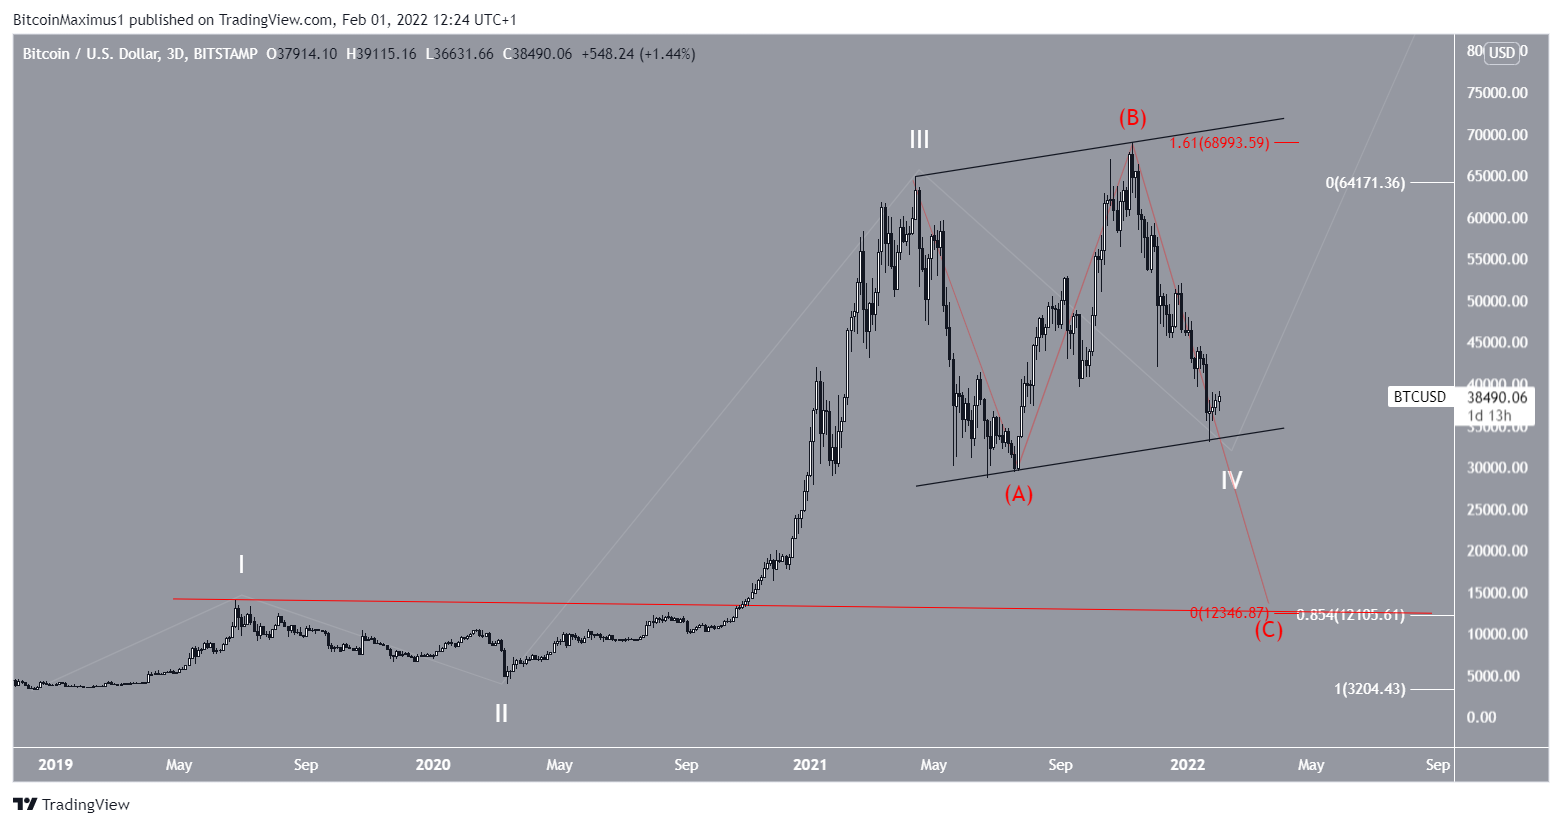
BTC began a long-term five wave upward movement in Dec 2018 (white). The most likely scenario suggests that wave three was completed on April 11 and BTC has been correction inside wave four since.
Due to the concept of alternation, waves two and four should be different in either length of time or price. Since the waves have similar length of time (263 and 281 days), it would make sense for them to differ in their retracement levels.
Wave two was deep, reaching the 0.86 Fib retracement level (white). With this in mind, it would make sense for wave four to be shallower, ending at the 0.5 Fib retracement level (black), which has already been reached.
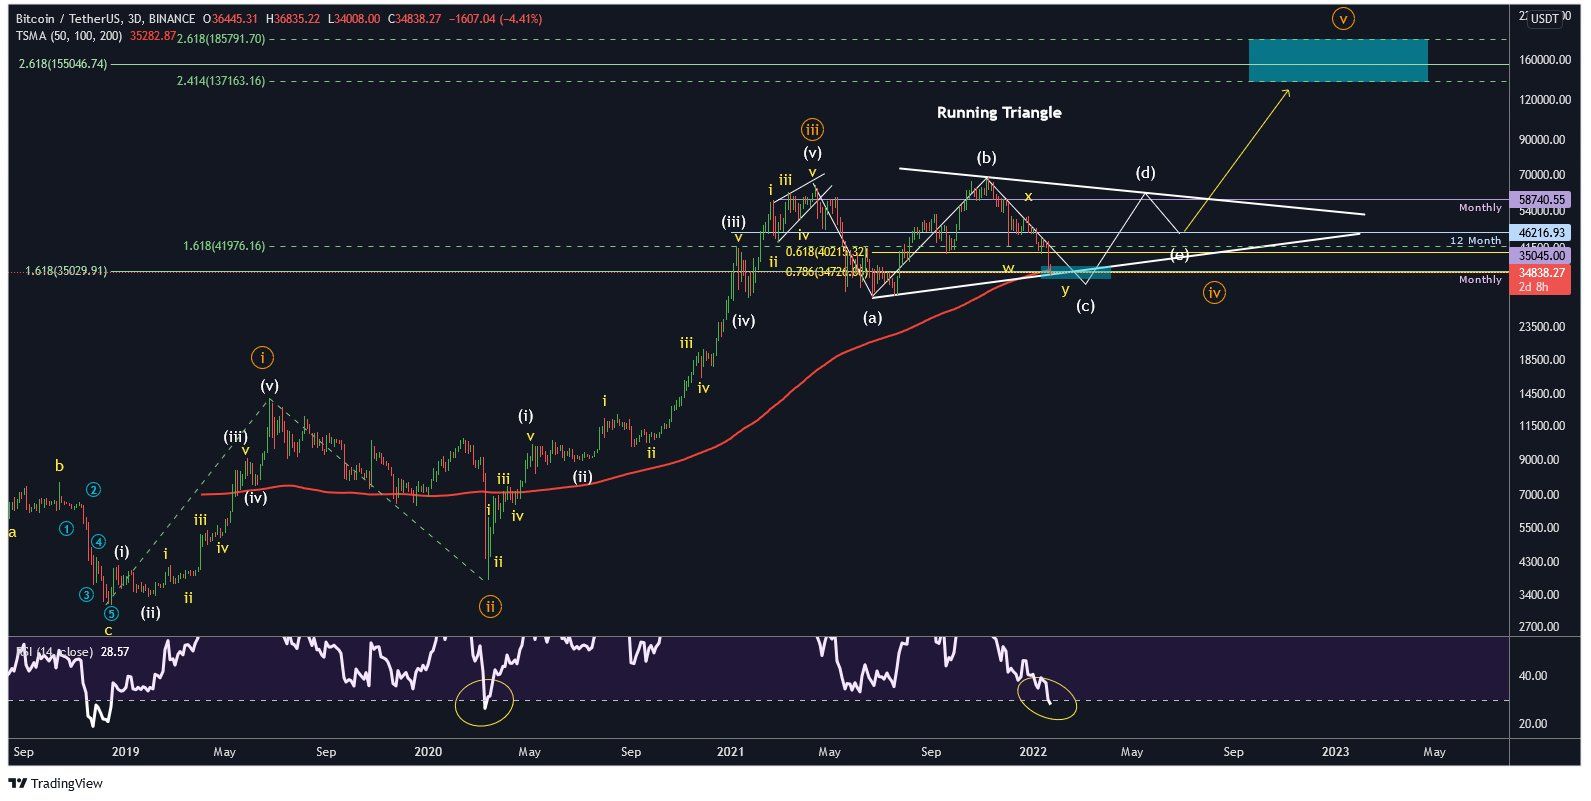
Cryptocurrency trader @24kCrypto posted a BTC chart, in which the price is completing a long-term fourth wave triangle. He also indicated that the RSI has given a bullish signal that previously occurred during the March 2020 bottom.
While it does seem that BTC is in a long-term wave four, there still seem to be several possible valid sub-wave counts.
The three most likely counts are presented in the image below.
The sharp correction (black) would suggest that another low is in store. The sideways correction (yellow) suggests that the low is in, but BTC will continue consolidating, while the red path suggests that the bottom is in.
Below, these three counts will be analyzed one by one in order to decide which is the most likely. For our previous wave count analysis, click here.
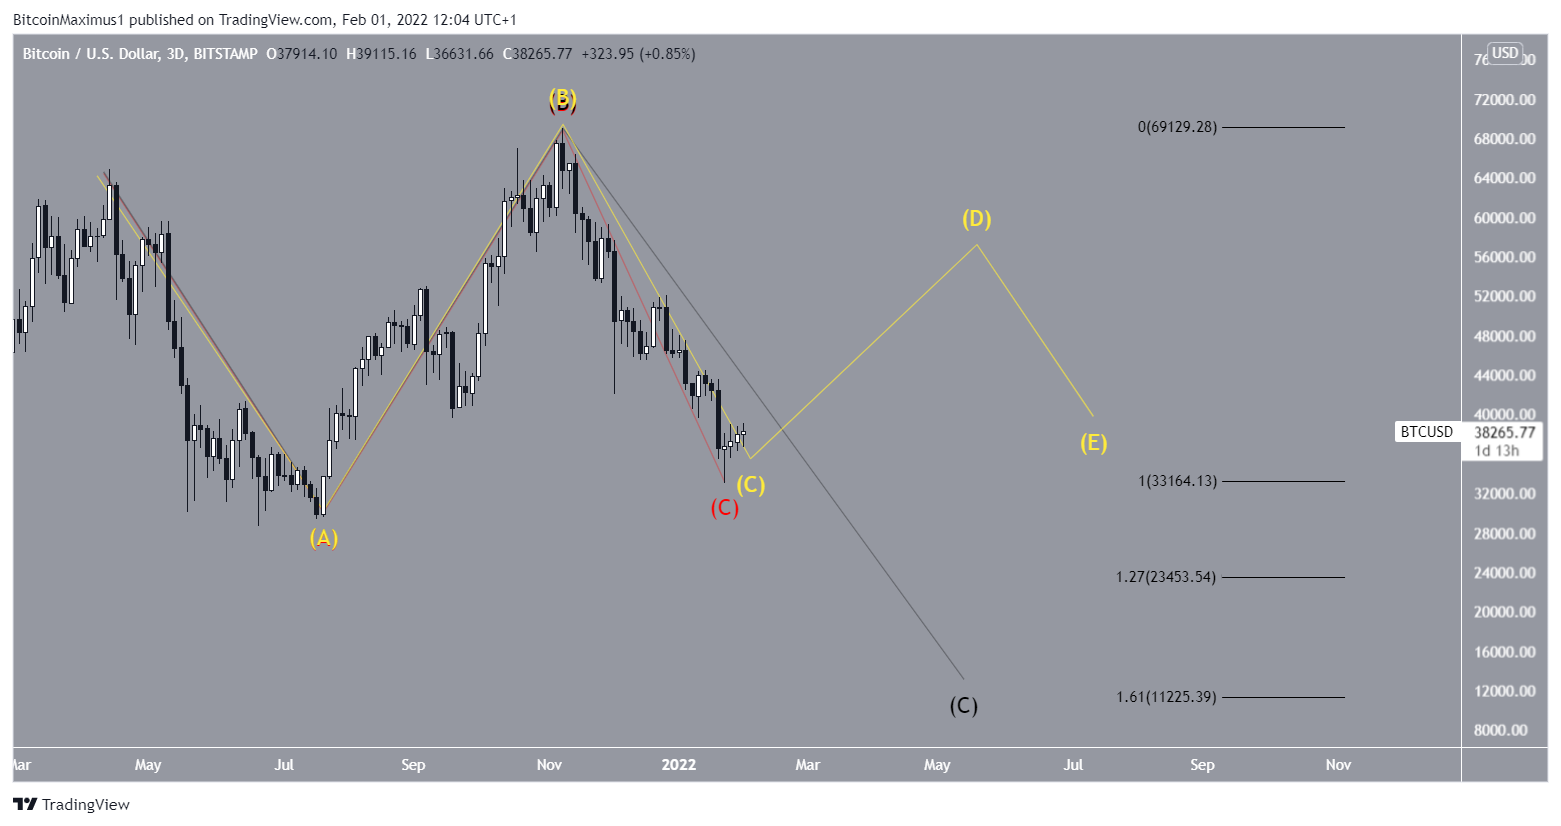
Sharp correction
The most bearish possibility is that BTC is in an irregular flat correction. This would mean that waves A:C would have a 1:1.61 ratio, leading to an eventual low of $12,345.
The sub-wave count is given in black, suggesting that BTC is in sub-wave three. In this possibility, it would break down from the channel, validate it as resistance before resuming its downward movement.
Also, this would not align well with the previously discussed concept of alternation, since waves two and four would be very similar in length of retracement, both falling to the 0.85 Fib retracement support level.
Finally, a low of $12,346 would break the wave one high (red line), hence rendering this an invalid correction based on EW theory.
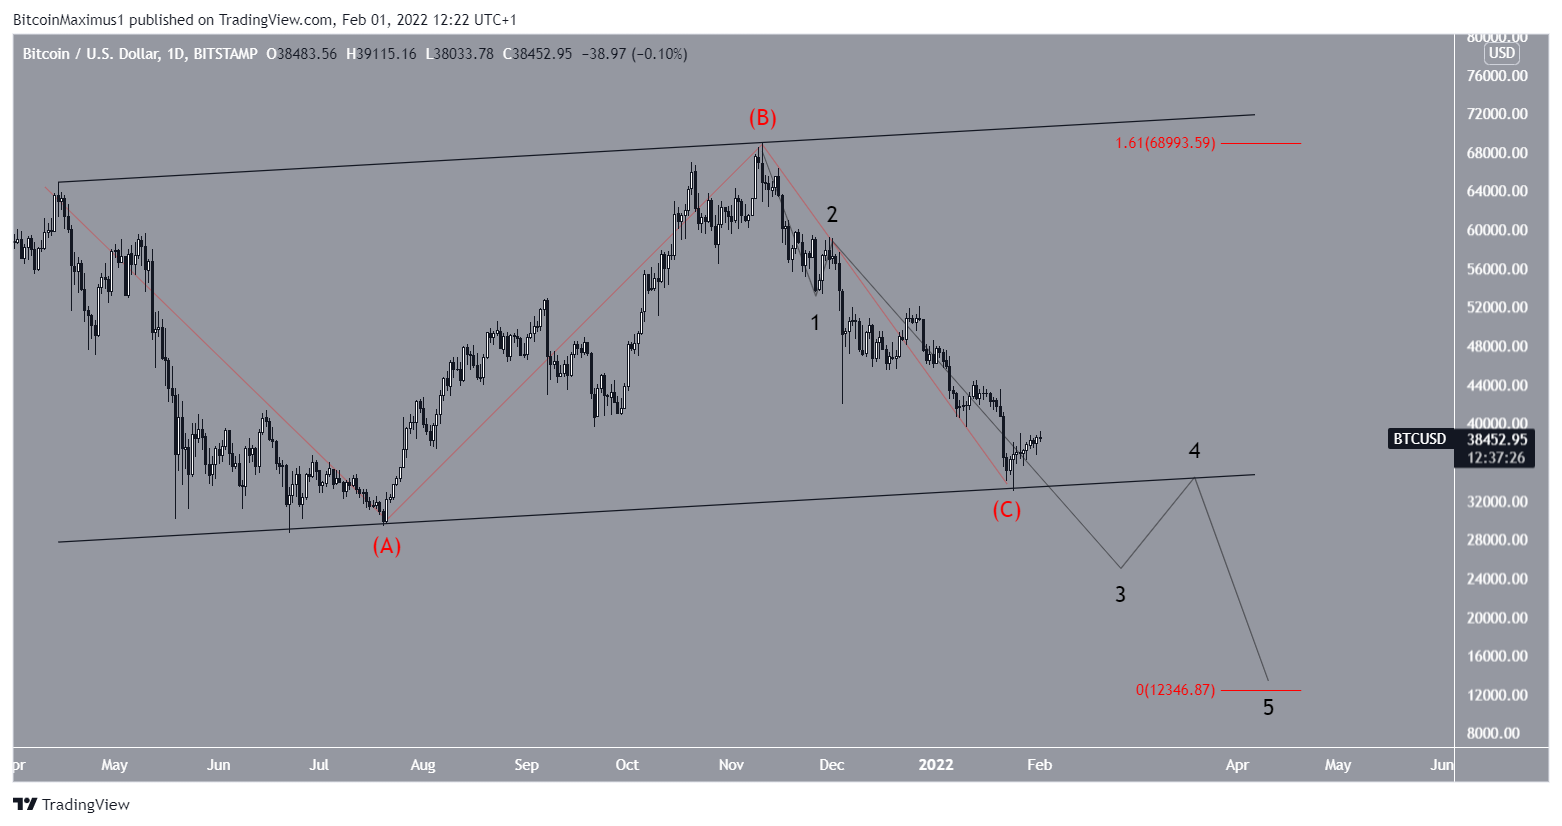
Sideways correction
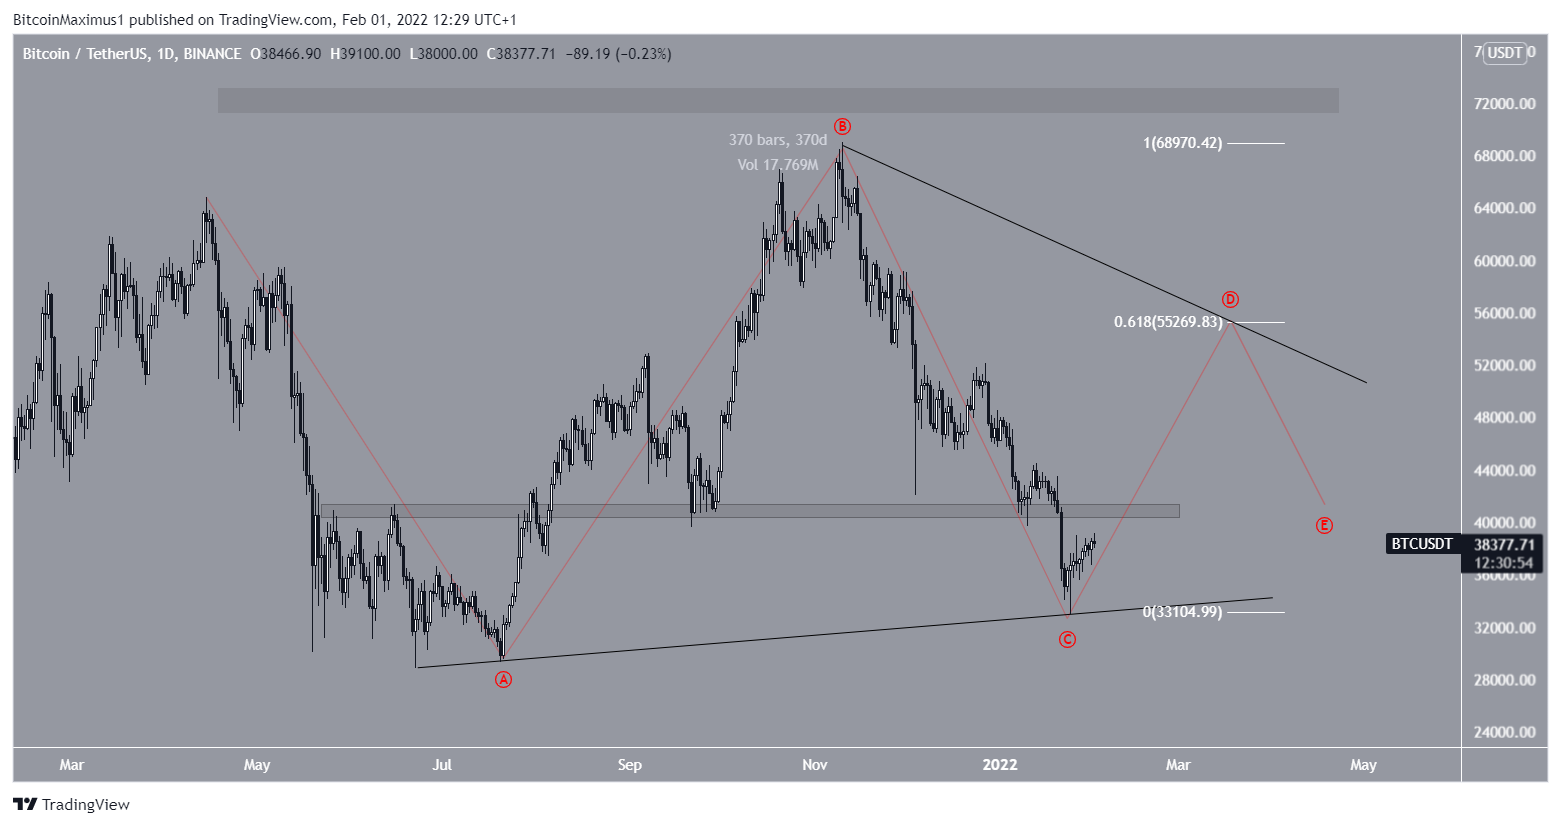
The neutral possibility suggests that BTC is mired in a fourth wave triangle.
In this scenario, BTC would increase towards $55,250, the 0.618 Fib retracement resistance level before falling once more. The entire movement would complete a symmetrical triangle, from which an eventual breakout would be likely.
Besides the fact that the correction could go on for nearly 400 days, this possibility does not break any EW rules.
Correction is complete
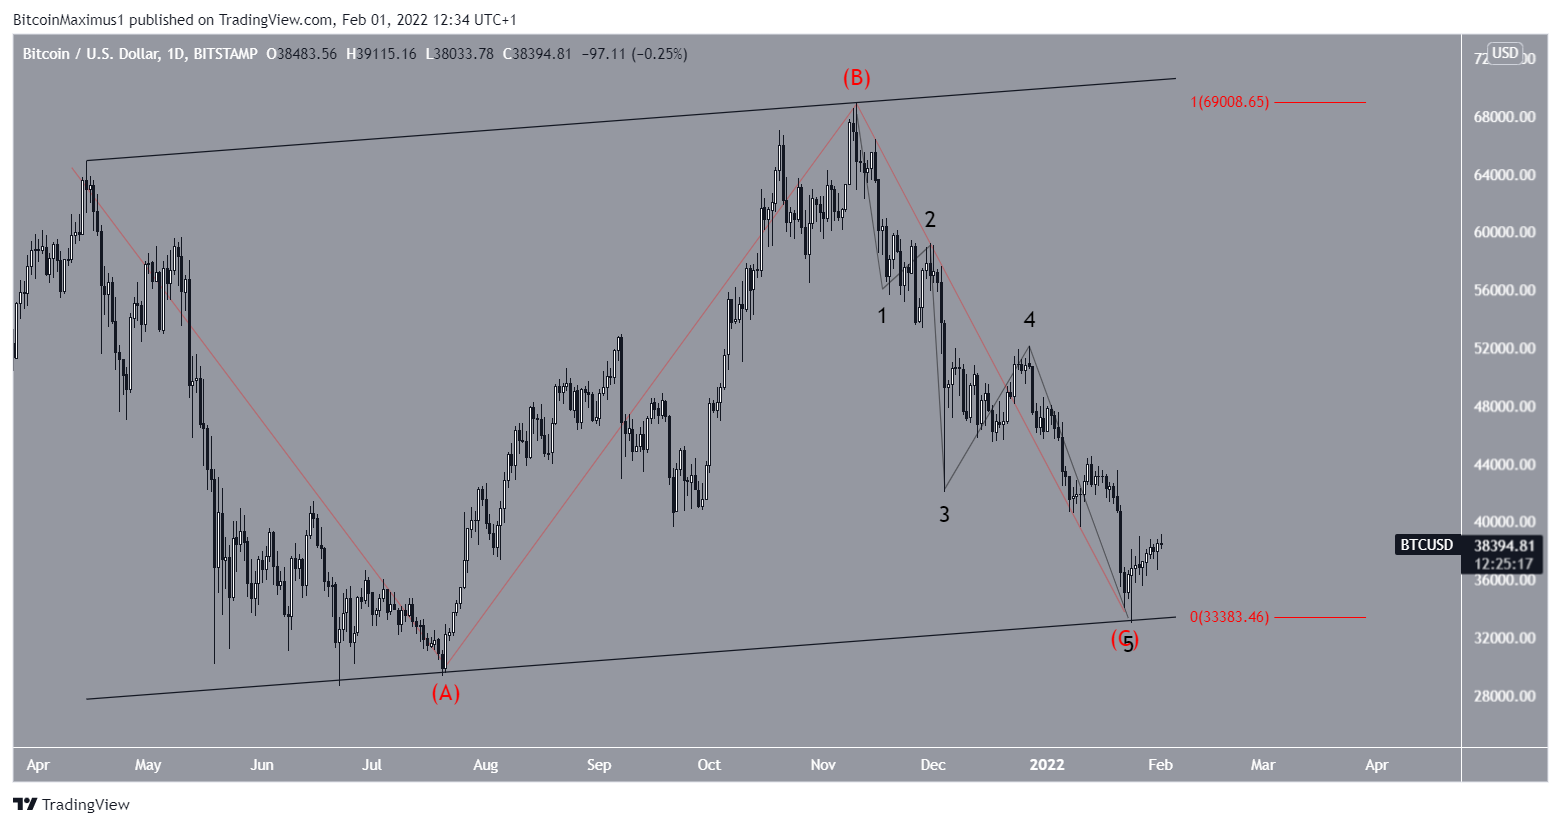
The final and most likely possibility suggests that BTC has completed its long-term wave four inside the current ascending parallel channel. In it, waves A:C have had an exactly 1:1 ratio, which is the most common one in such corrections.
This would effectively complete a running flat correction.
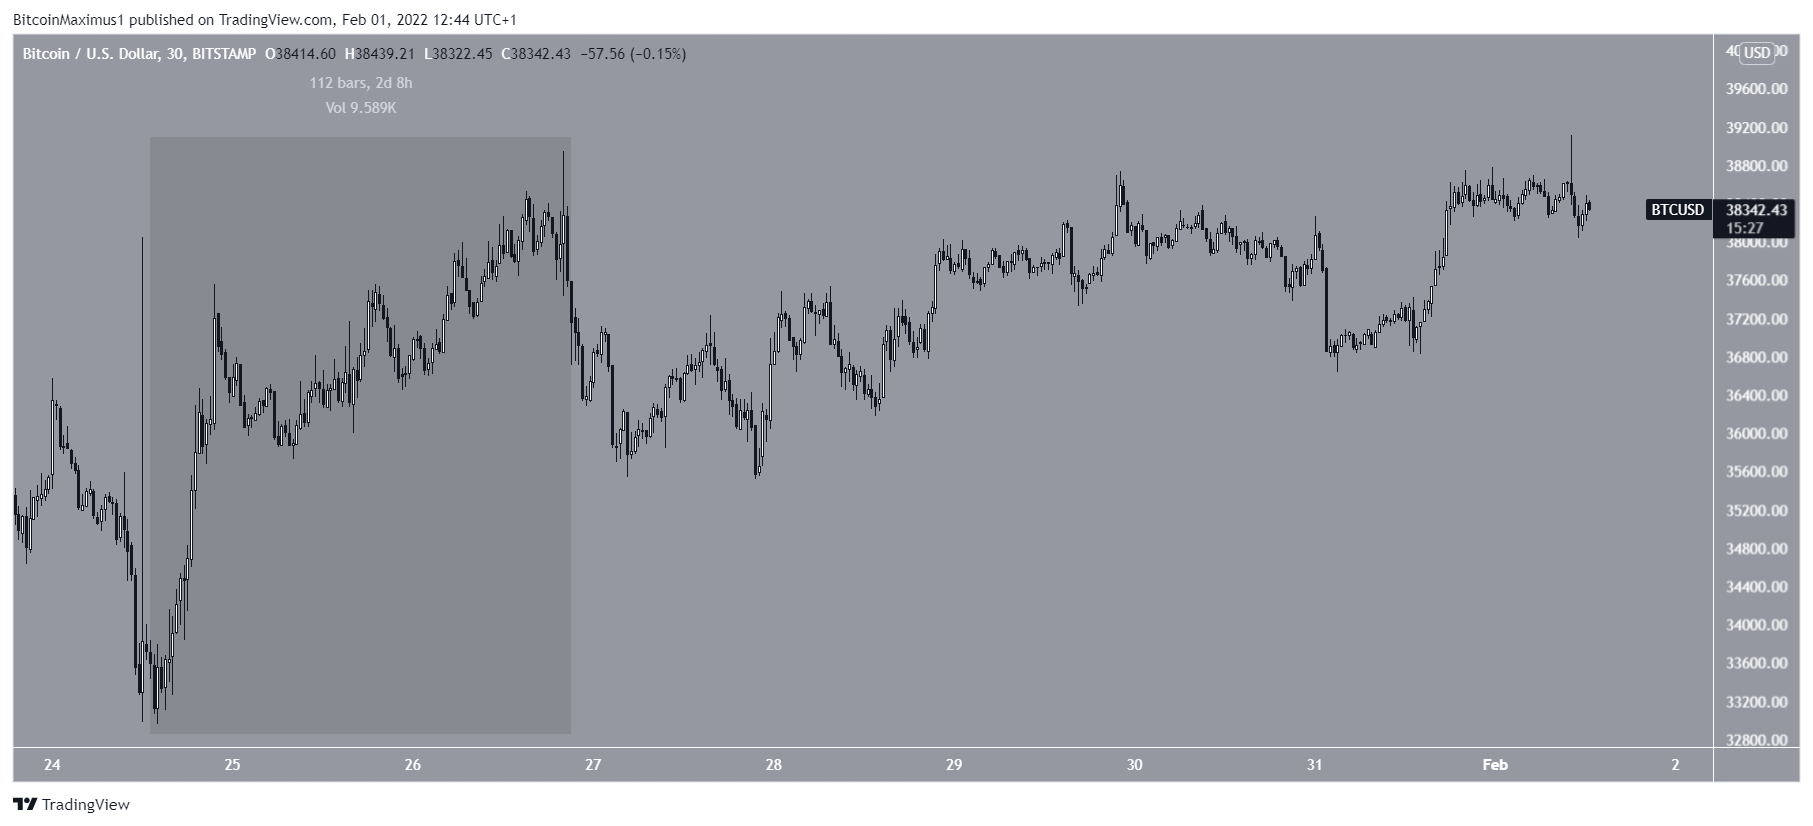
The main issue with this count is the short-term movement. Since the Jan 24 low, the ensuing bounce does resemble a three wave structure more than a five wave one.
This could either mean that BTC will make a slightly lower low near $34,000 but still respect the channel, or that the previously outlined triangle possibility will play out.
The short-term movement over the next few days will be crucial in determining which of these possibilities will transpire.
For BeInCrypto’s latest Bitcoin (BTC) analysis, click here