
Bitcoin (BTC) increased on Aug. 29, creating a bullish engulfing candlestick in the process to move back above $20,000. It will still likely have to battle with a resistance zone near $21,500.
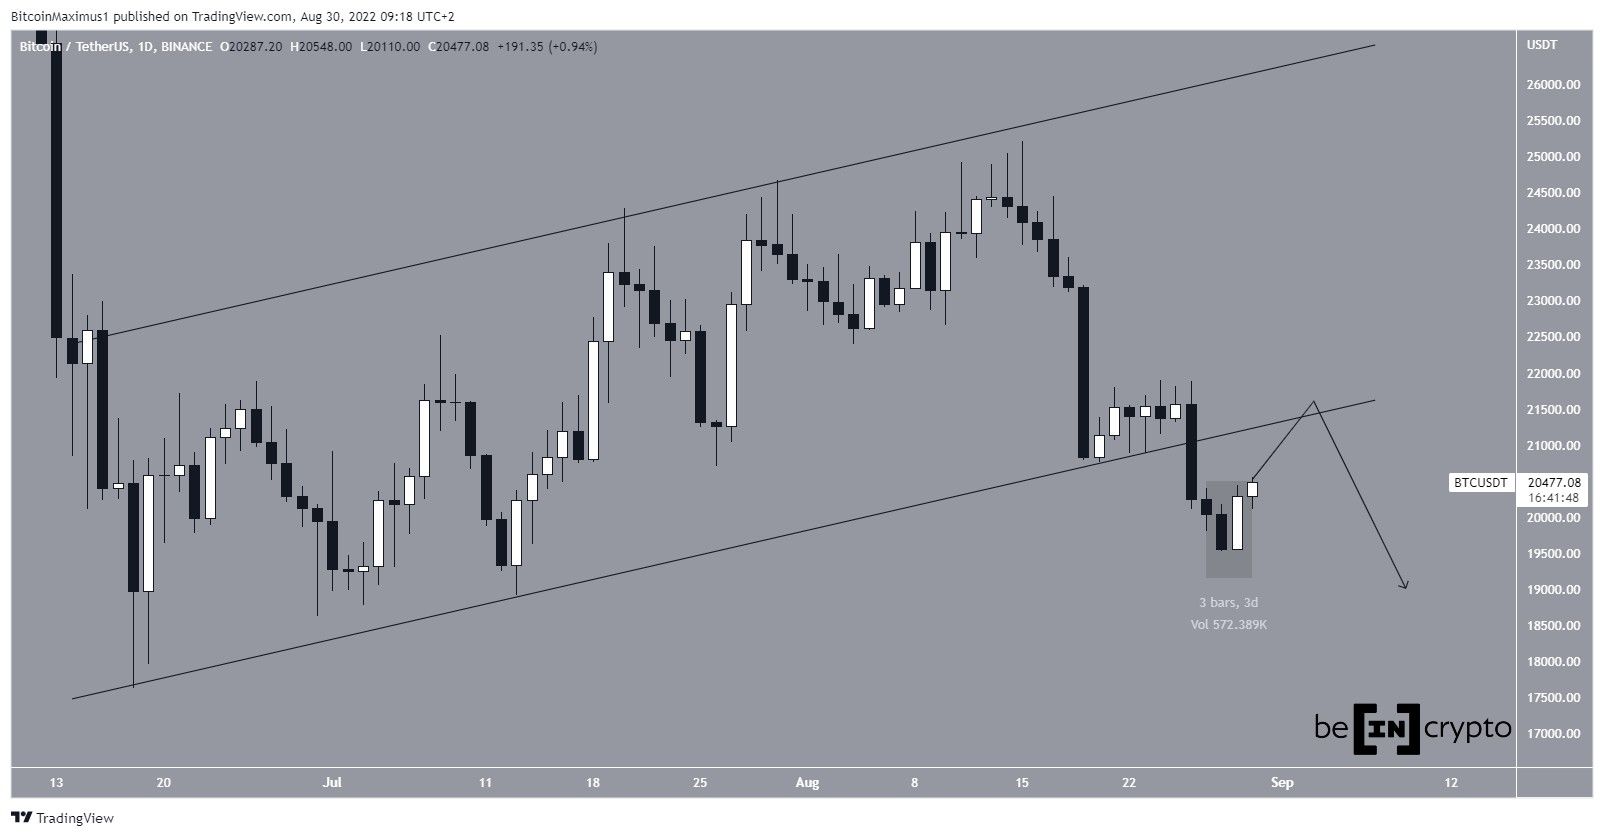
Bitcoin had been increasing inside an ascending parallel channel since reaching a low on June 18. Such channels usually contain corrective movements, meaning that an eventual breakdown would be the most likely scenario.
Indeed, Bitcoin broke down on Aug. 26 and fell to $19,520 on Aug. 29. However, BTC rebounded the next day and created a bullish engulfing candlestick (highlighted).
It is possible that this is the beginning of an upward movement that causes a validation of the previous support line as resistance. Even so, due to the breakdown from such a long-term pattern, a rejection and continuation of the downward trend would be the most likely scenario, as outlined in the chart below.
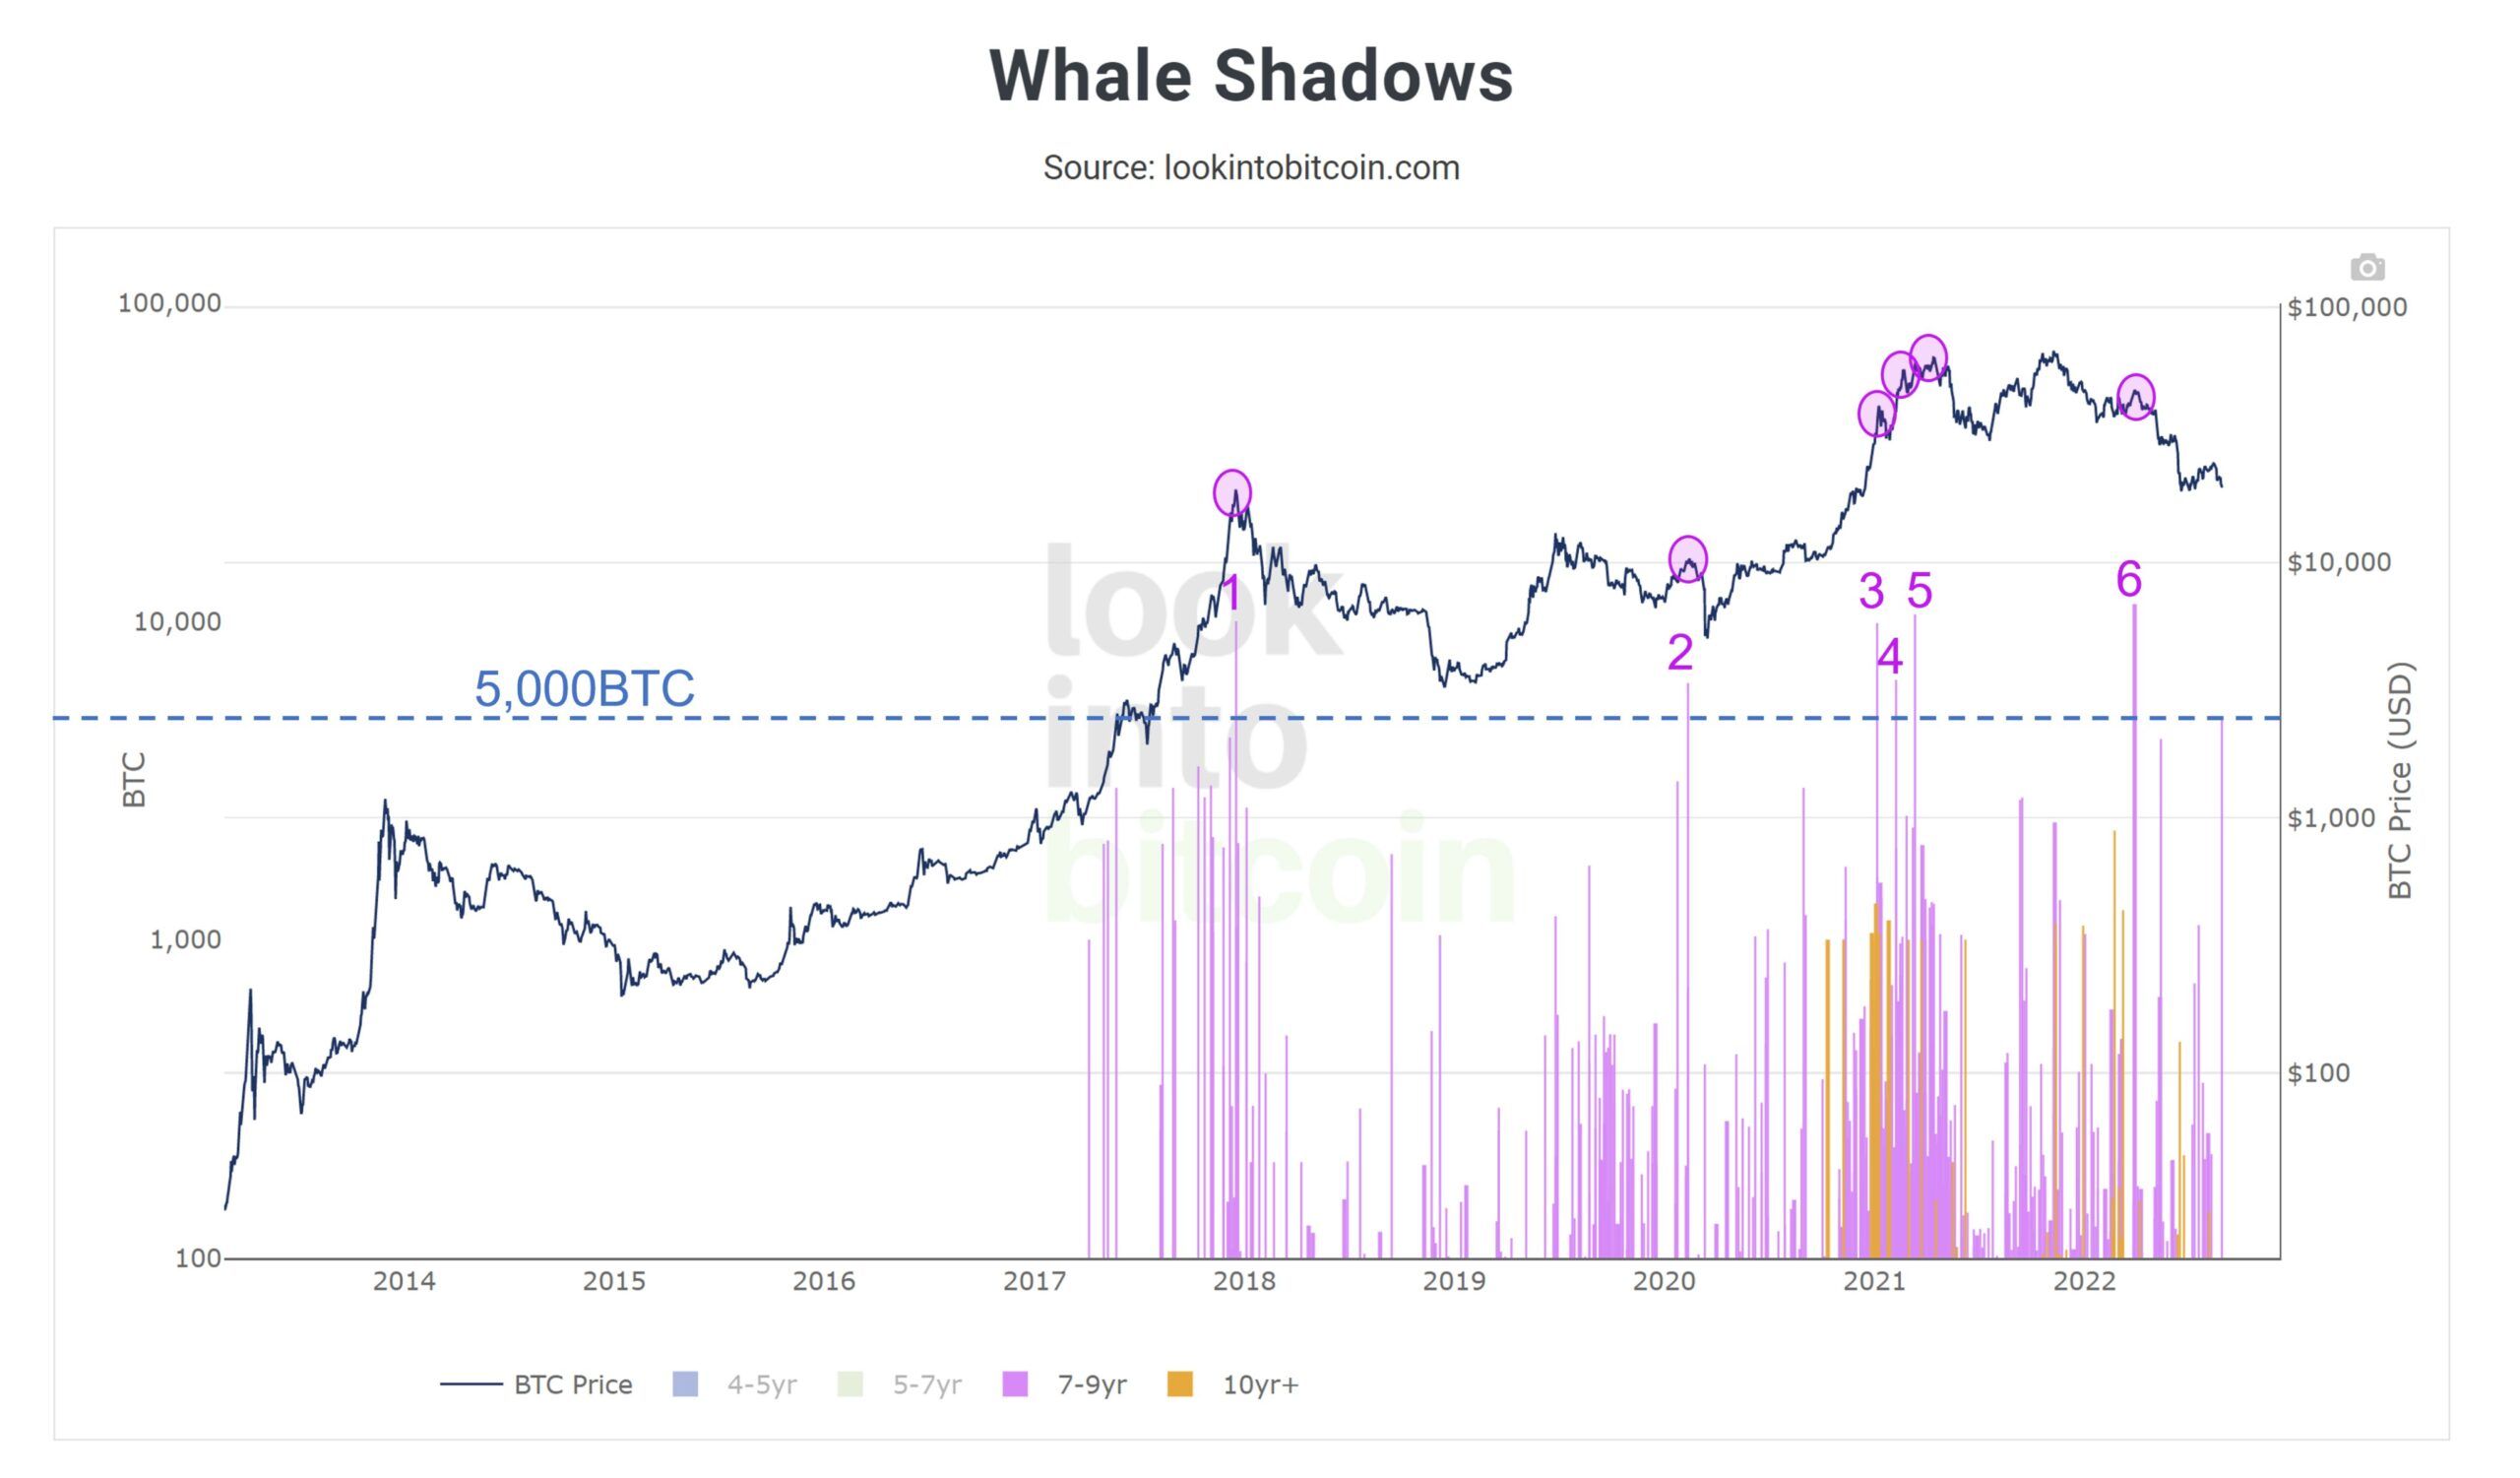
This potential downward movement is also supported by on-chain data. On Aug. 30, 5000 BTC that had previously been dormant for 7-9 years finally moved. All six previous instances in which such a large portion of BTC tokens moved were followed by sharp downward movements.
Short-term movement
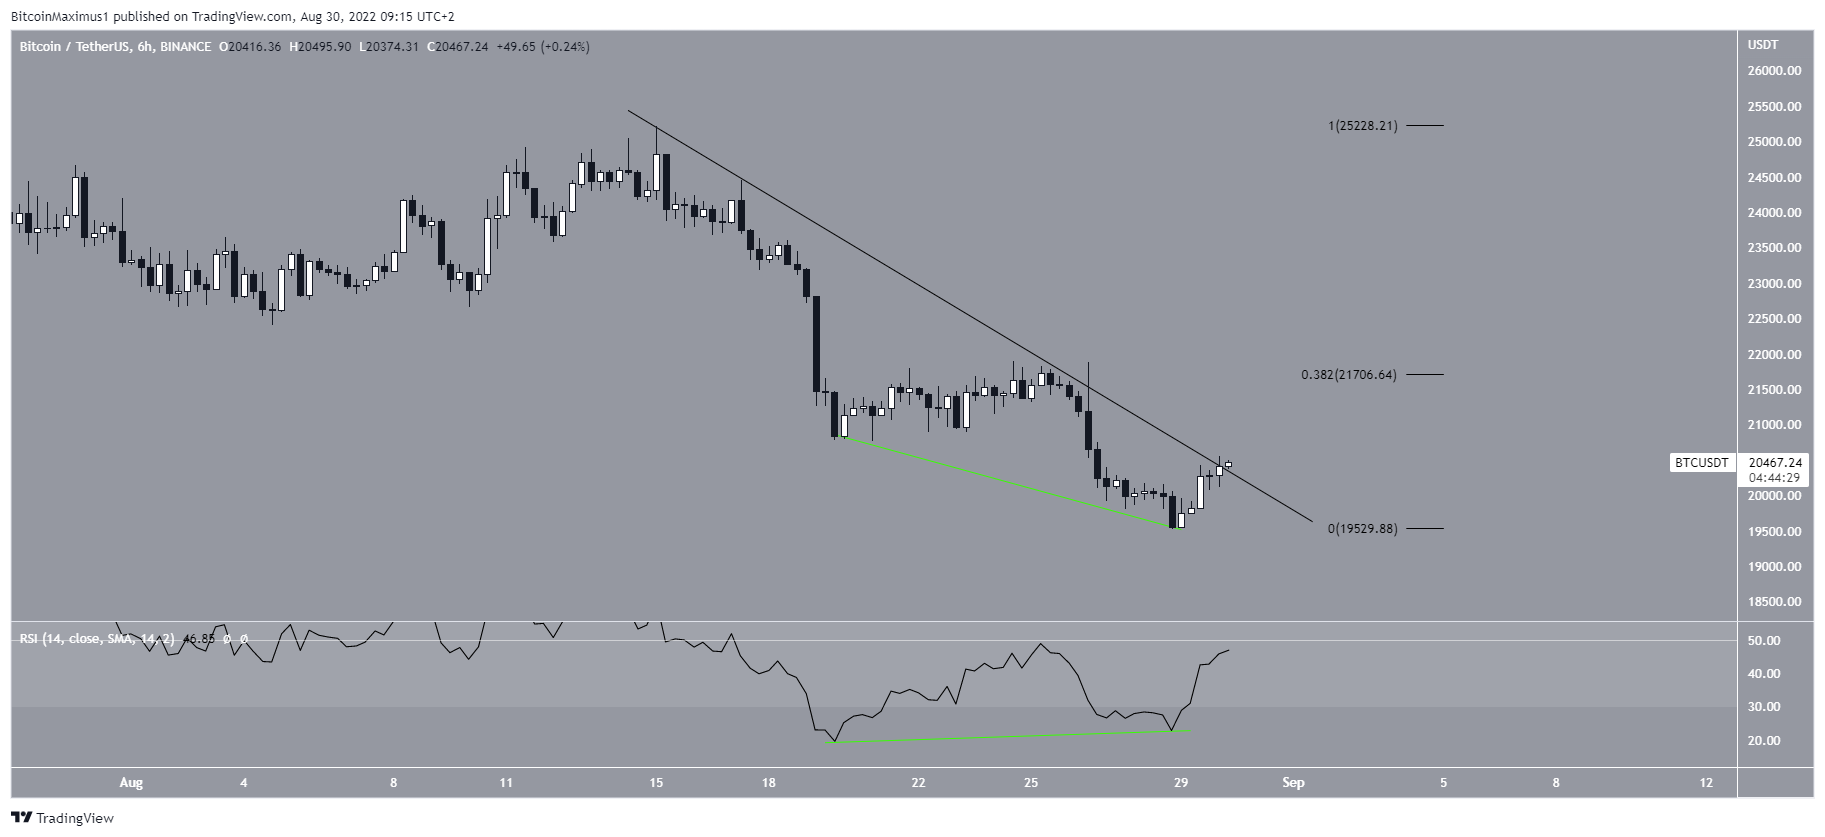
The six-hour chart supports the possibility of a relief rally. The reason for this is a bullish divergence in the six-hour RSI, which has developed over the two most recent lows.
Currently, Bitcoin is making its fourth attempt at breaking out above the line. Since lines get weaker each time they are tested, a breakout from the line is likely.
If this occurs, the closest resistance area would be found near $21,700. This is the 0.382 Fib retracement resistance level when measuring the entire downward move.
BTC wave count analysis
The longer-term wave count suggests another downward movement is still likely, aligning with the on-chain readings. Additionally, due to the Fed chair prioritizing higher interest rates in order to tame inflation, JPMorgan warned to stay away from Bitcoin, other cryptocurrencies and large cap tech stocks.
However, the short-term count is also in alignment with the readings from the six-hour chart, suggesting that an initial upward move is expected.
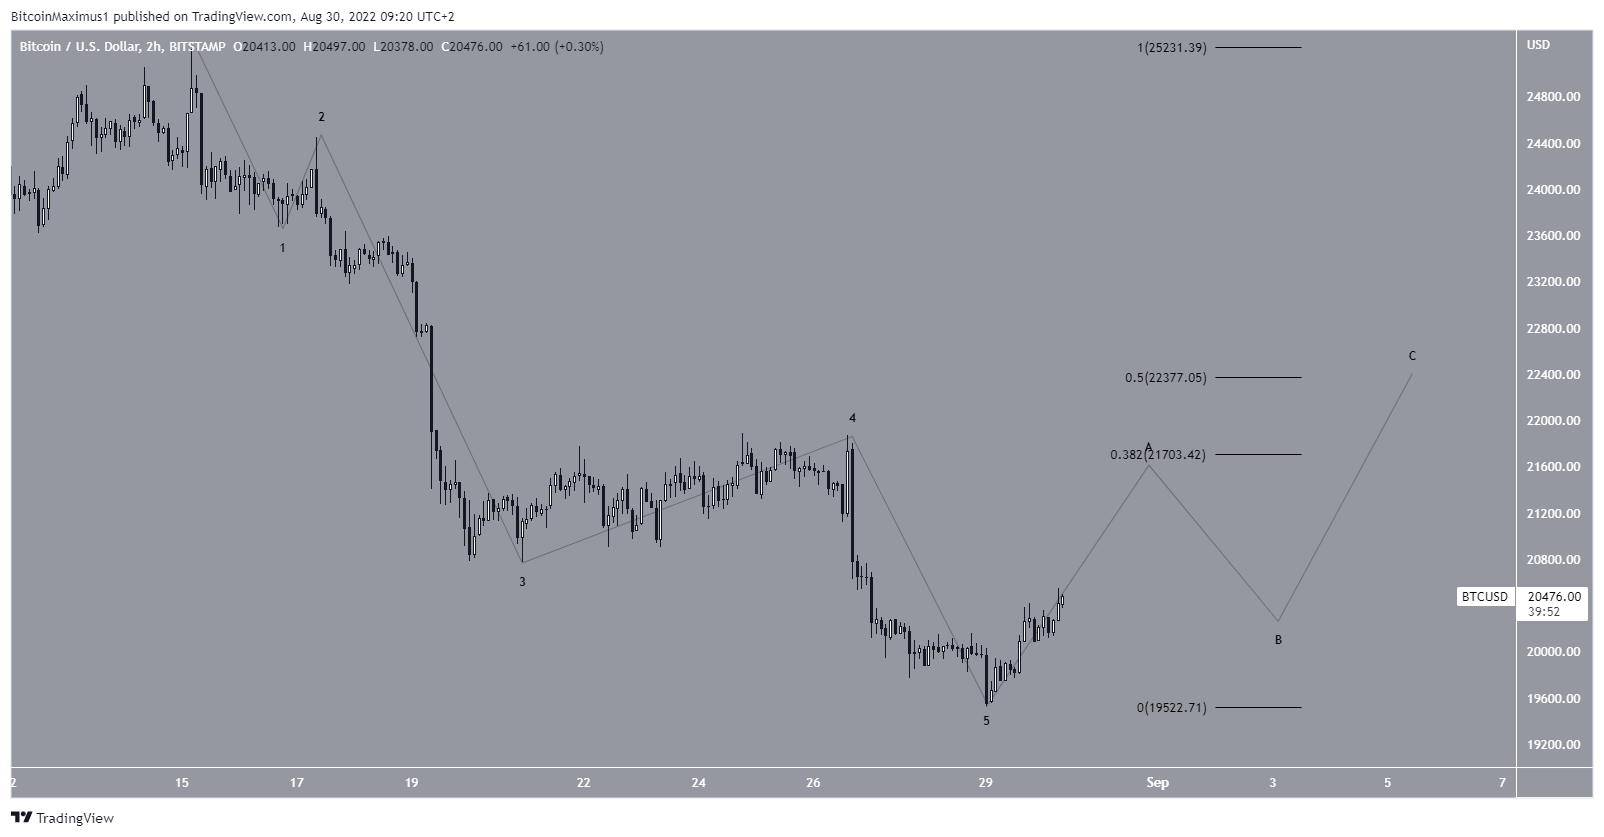
After completing a five-wave downward pattern, BTC seems to have begun an A-B-C corrective structure.
The most likely area for the top of this corrective rally would be found between the 0.382 and 0.5 Fib retracement resistance levels at $21,700 and $22,400.
For Be[in]Crypto’s previous Bitcoin (BTC) analysis, click here