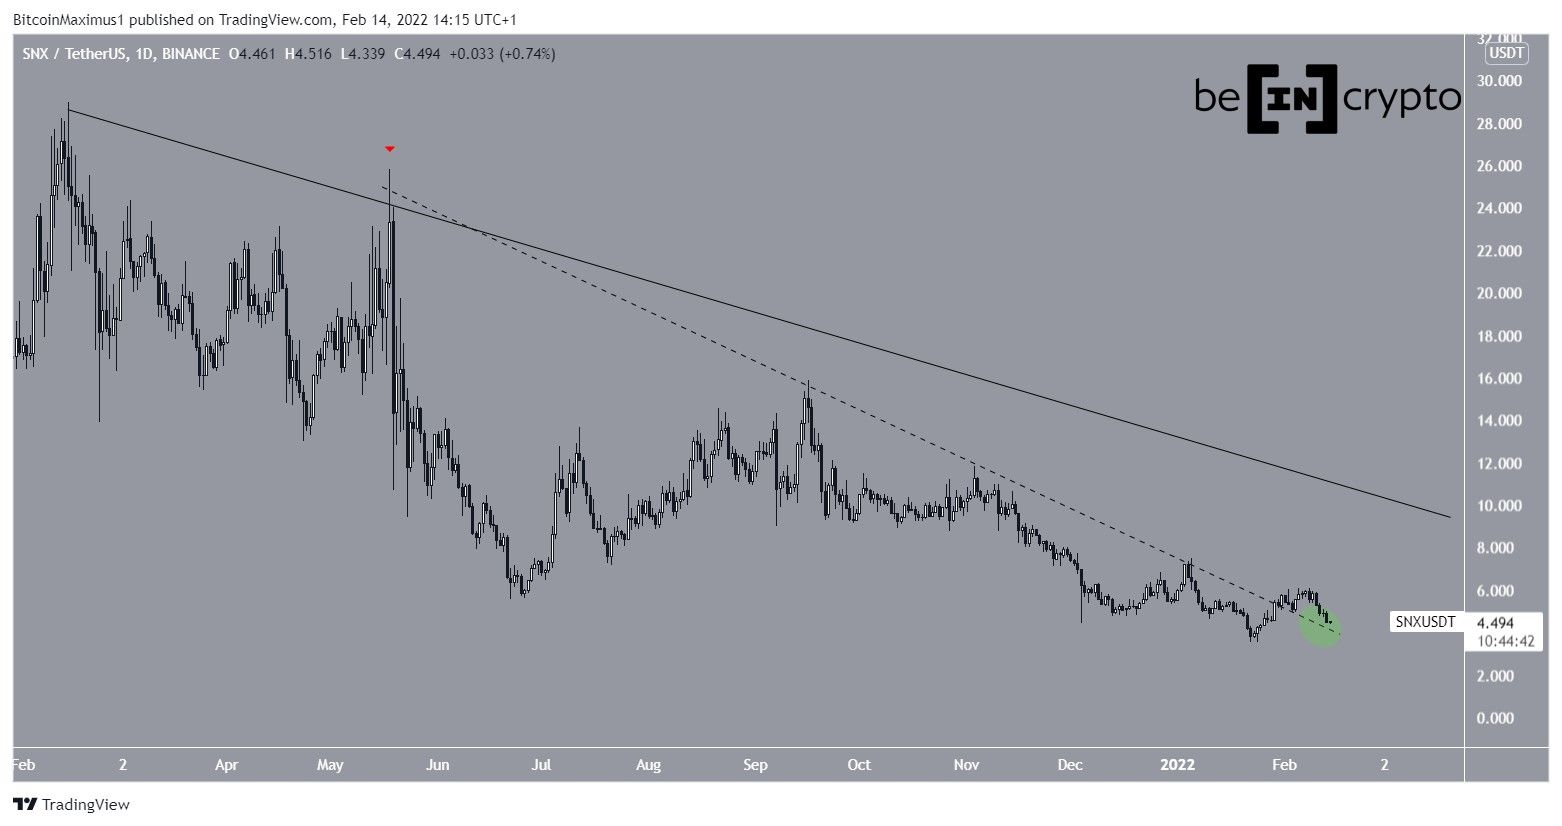
Synthetix (SNX) has broken down from a long-term support area, but is showing strong signs of a potential bullish reversal.
SNX has been decreasing alongside a descending resistance line since reaching an all-time high price of $28.94 on Feb 14. More recently, it has been rejected by the line on May 18 (red icon).
Afterwards, it started following another descending resistance line, this one steeper than the previous. On Jan 31, it broke out from this line and is currently in the process of validating it as support (green circle).
The longer-term resistance line is currently near $10.
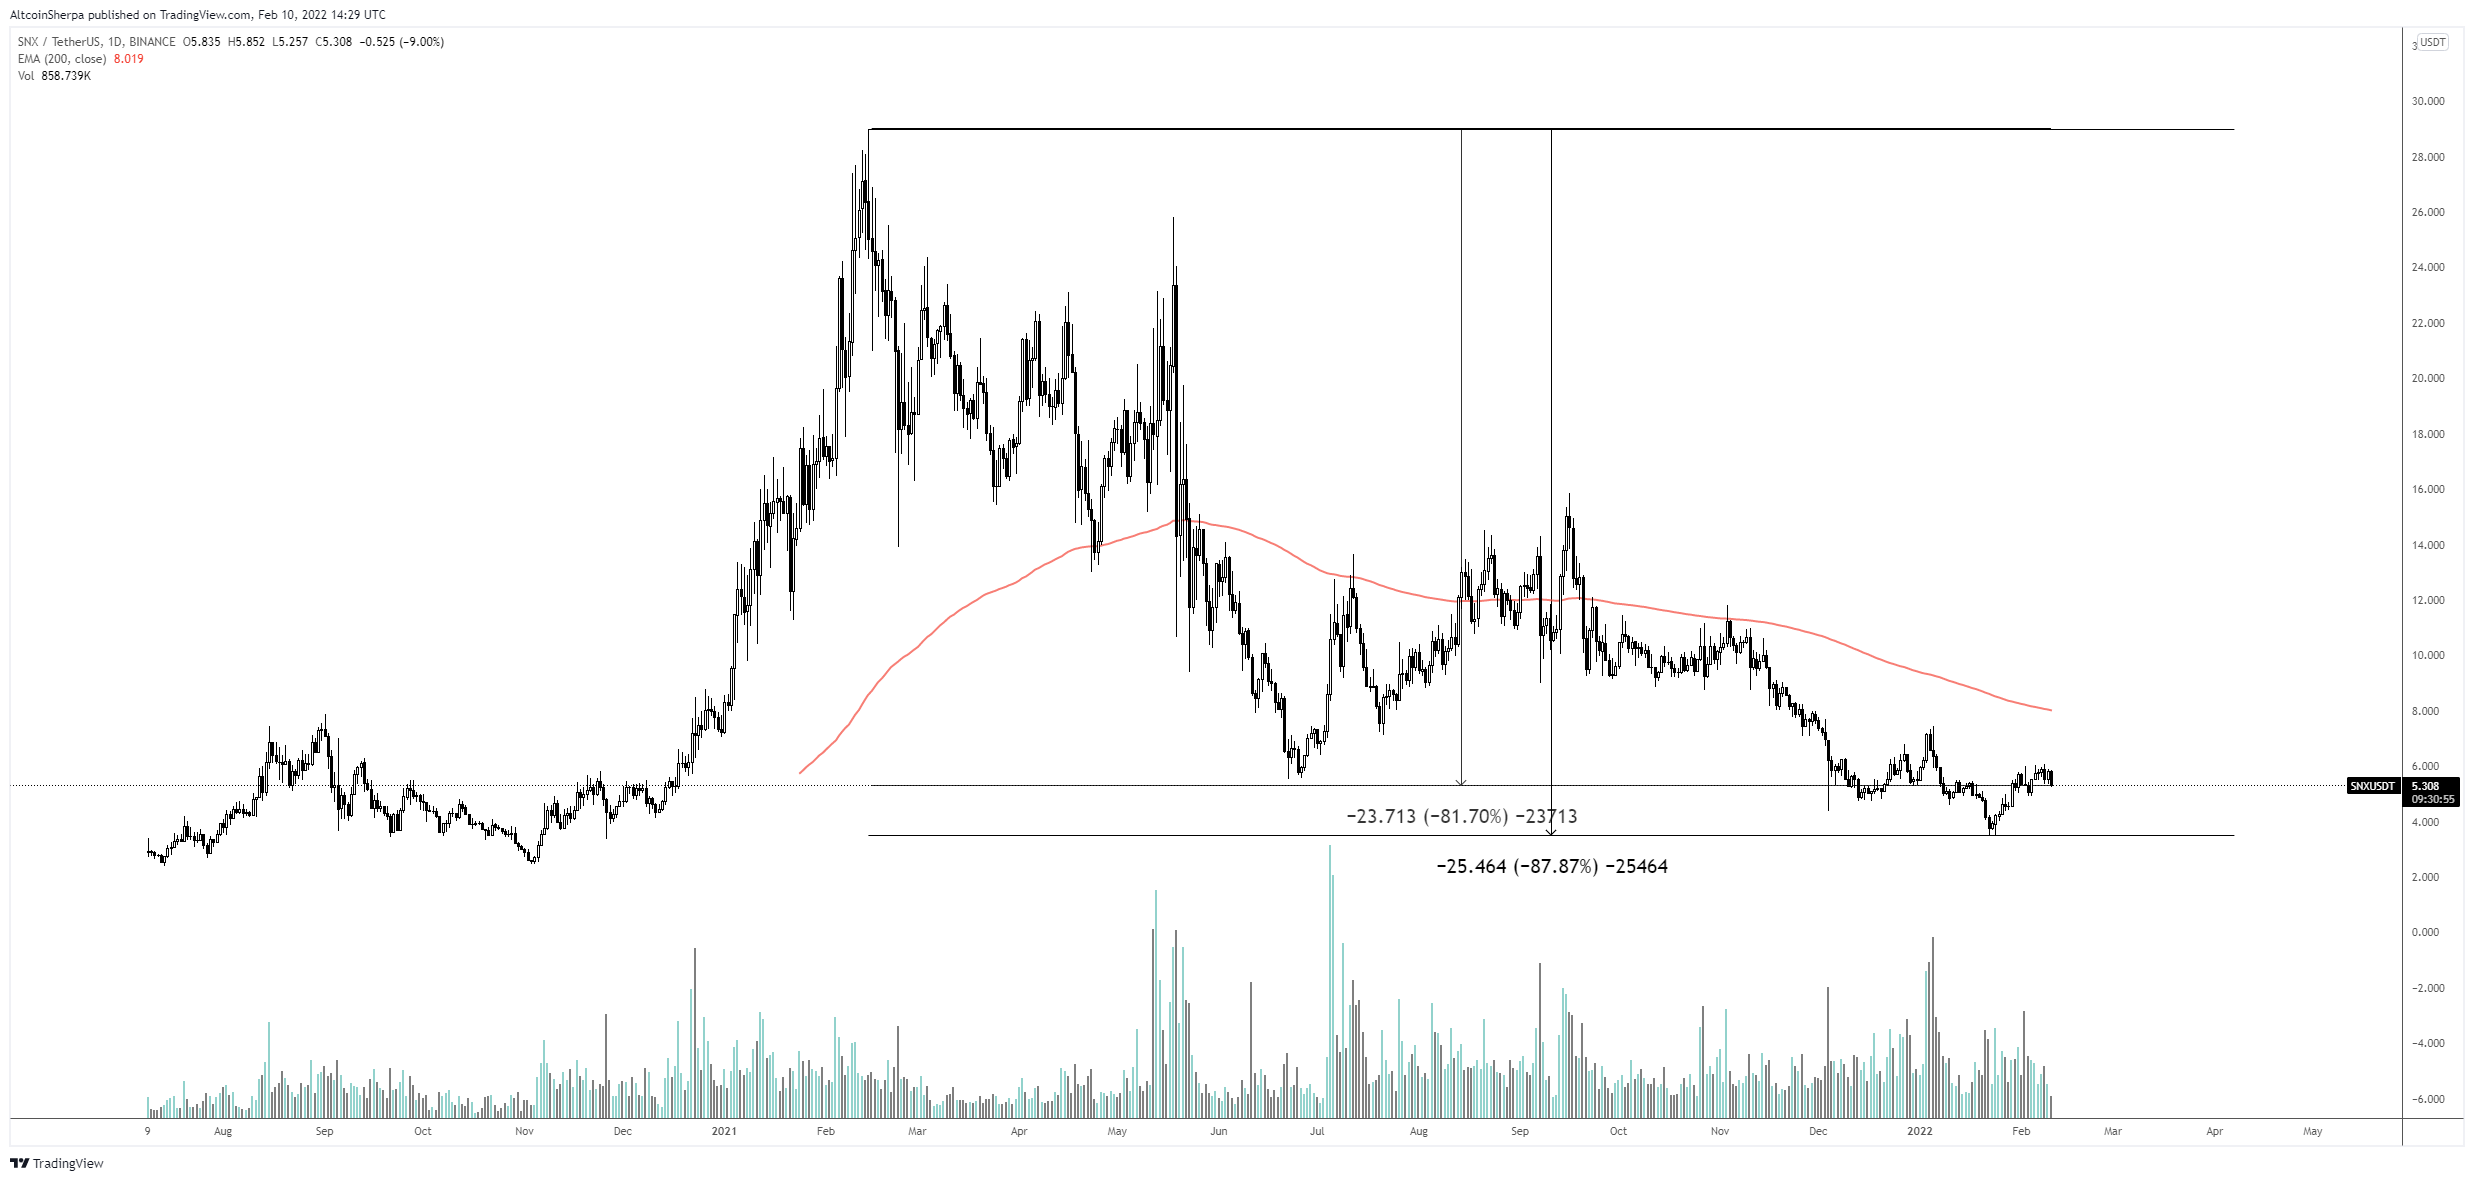
Cryptocurrency trader @Altcoinsherpa tweeted a chart of SNX, which shows that the token has decreased by 87% since its all-time high price.
Potential reversal
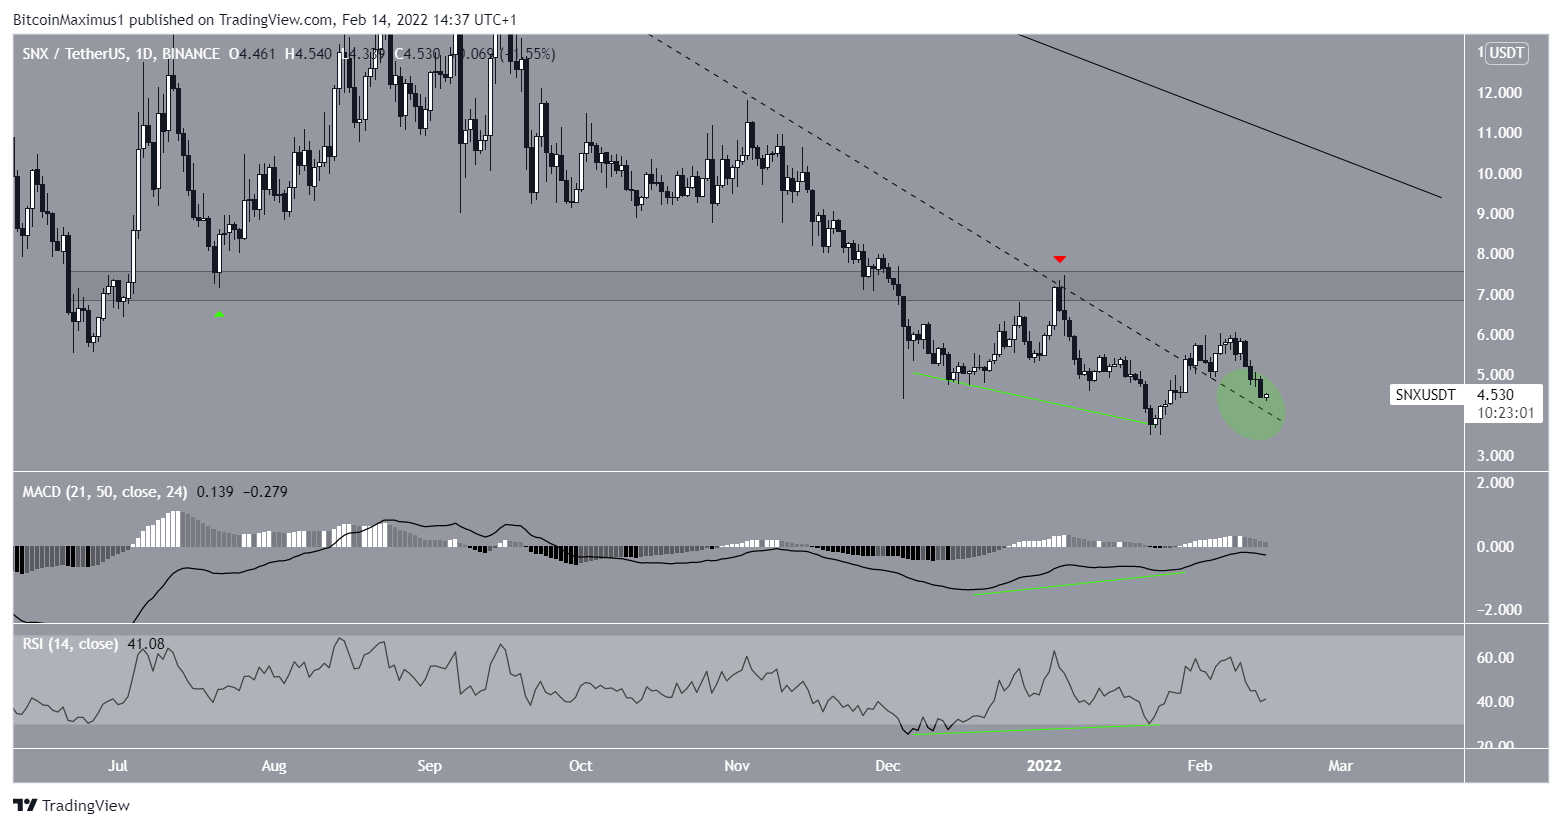
A closer look at the daily chart shows that SNX has broken down from the $7.20 area and validated it as resistance afterwards (red icon). Previously, the area had acted as support since July 2021.
Despite the drop, both the RSI and MACD have generated very significant bullish divergences. These divergences preceded the breakout from the short-term descending resistance line.
Due to the fact that they developed over a significant period of time, it is possible that the upward movement as a result of the divergences has not yet ended.
However, until SNX manages to reclaim both the horizontal area and the descending resistance line, the trend cannot be considered bullish.
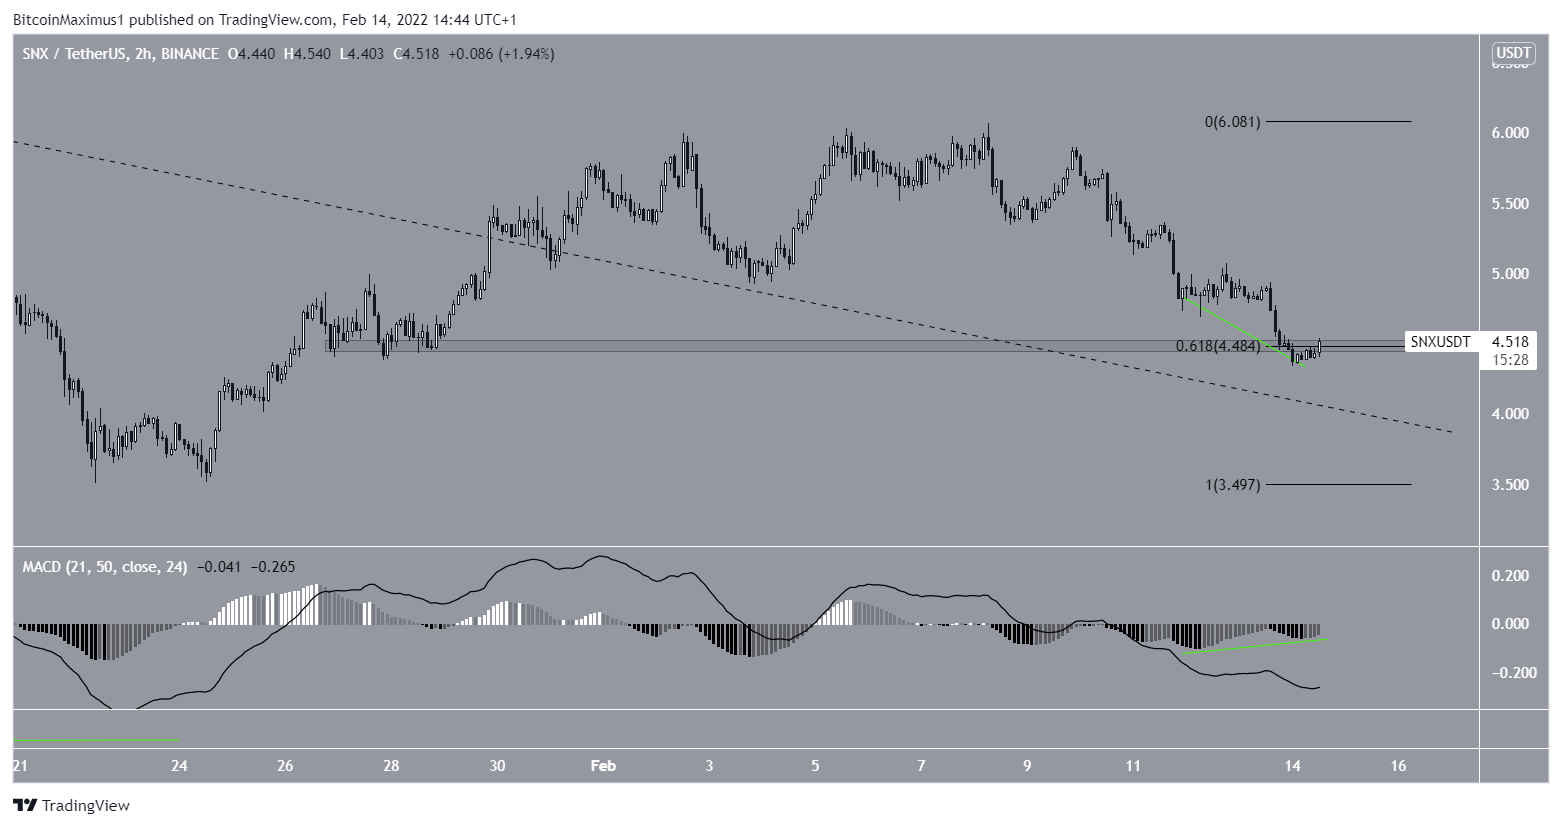
In the short-term, SNX is trying to reclaim the $4.50 horizontal support area, which is also the 0.618 Fib retracement support level.
Similarly to the daily time-frame, the two-hour MACD has generated bullish divergence.
A successful reclaim of this area would support the possibility that the downward movement has come to an end.
If so, the most likely path would suggest an increase towards the long-term descending resistance line at $10.
BeInCrypto’s latest Bitcoin (BTC) analysis, click here