CRV has broken out from a long-term descending resistance line
It has also broken out from a short-term ascending parallel channel
CRV/BTC has moved above the 8,350 resistance area
promo
Developing the Next-generation DAO Operating System Read Now
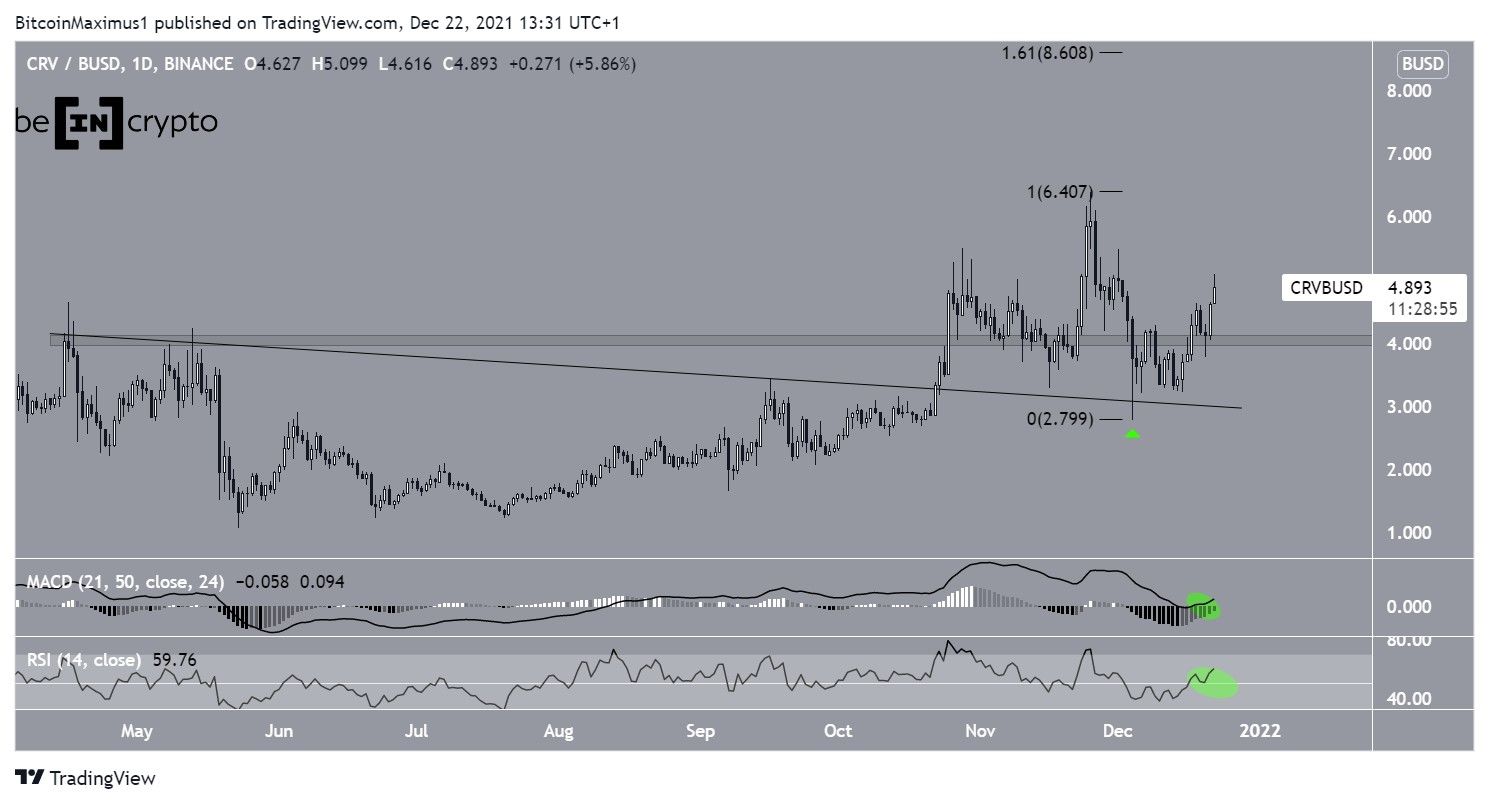
CurveDAO Token (CRV) has reclaimed the $4 horizontal resistance area and is now only 25% below its all-time high price.
On Dec, CRV broke out from a descending resistance line that had previously been in place since April. This led to a high of $6.4 on Nov 25.
While the token decreased afterwards, it validated this resistance line as support (green icon) on Dec 4 and bounced. Afterwards, it managed to reclaim the $4 horizontal area.
Technical indicators for CRV are also bullish.
The MACD, which is created by a short- and a long-term moving average (MA), is moving upwards and is positive. This means that the short-term MA is moving faster than the long-term one and is a sign of bullish trends.
Similarly, the RSI has crossed above 50 (green circle). This is another sign of a bullish trend.
The closest resistance is at the $6.40 all-time high. If successful in moving above it, the next resistance would be at $8.60, created by the 1.61 external Fib retracement resistance level when measuring the most recent drop.
Chart By TradingView
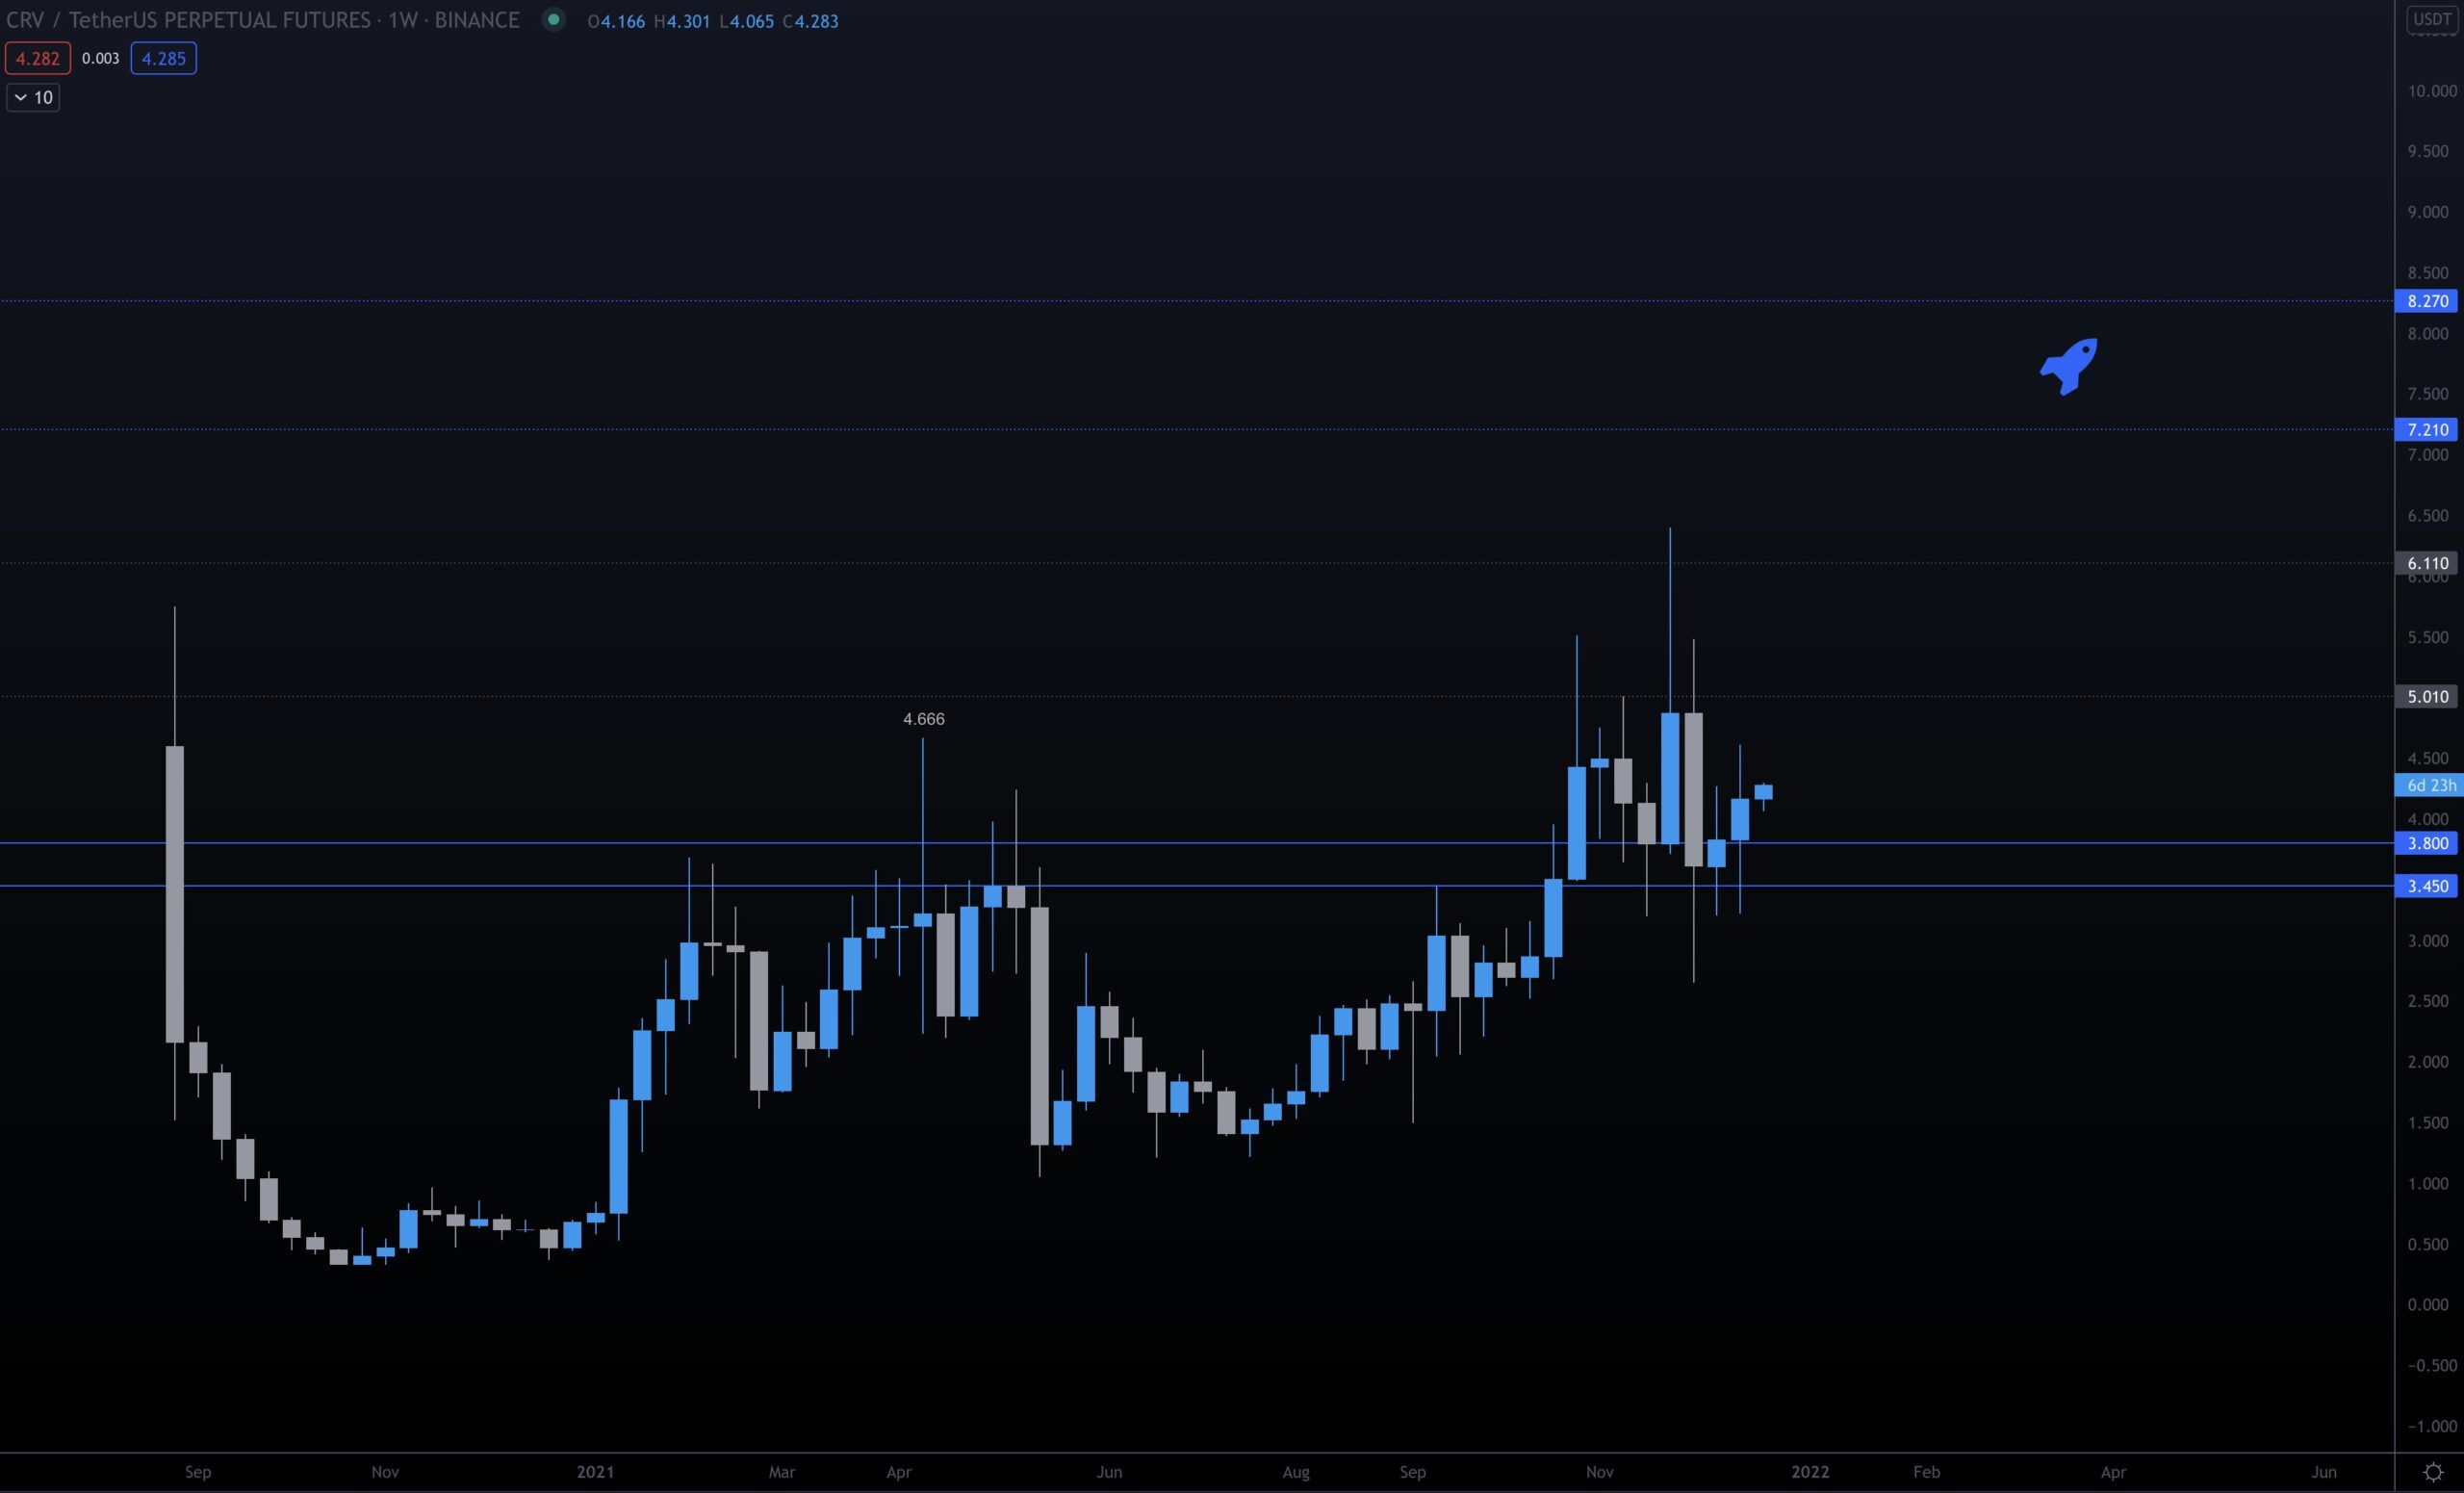
Cryptocurrency trader @TradingTank tweeted a CRV chart, stating that the price could increase all the way to $8. This fits with the resistance area created by the 1.61 external Fib retracement resistance level.
Source: Twitter
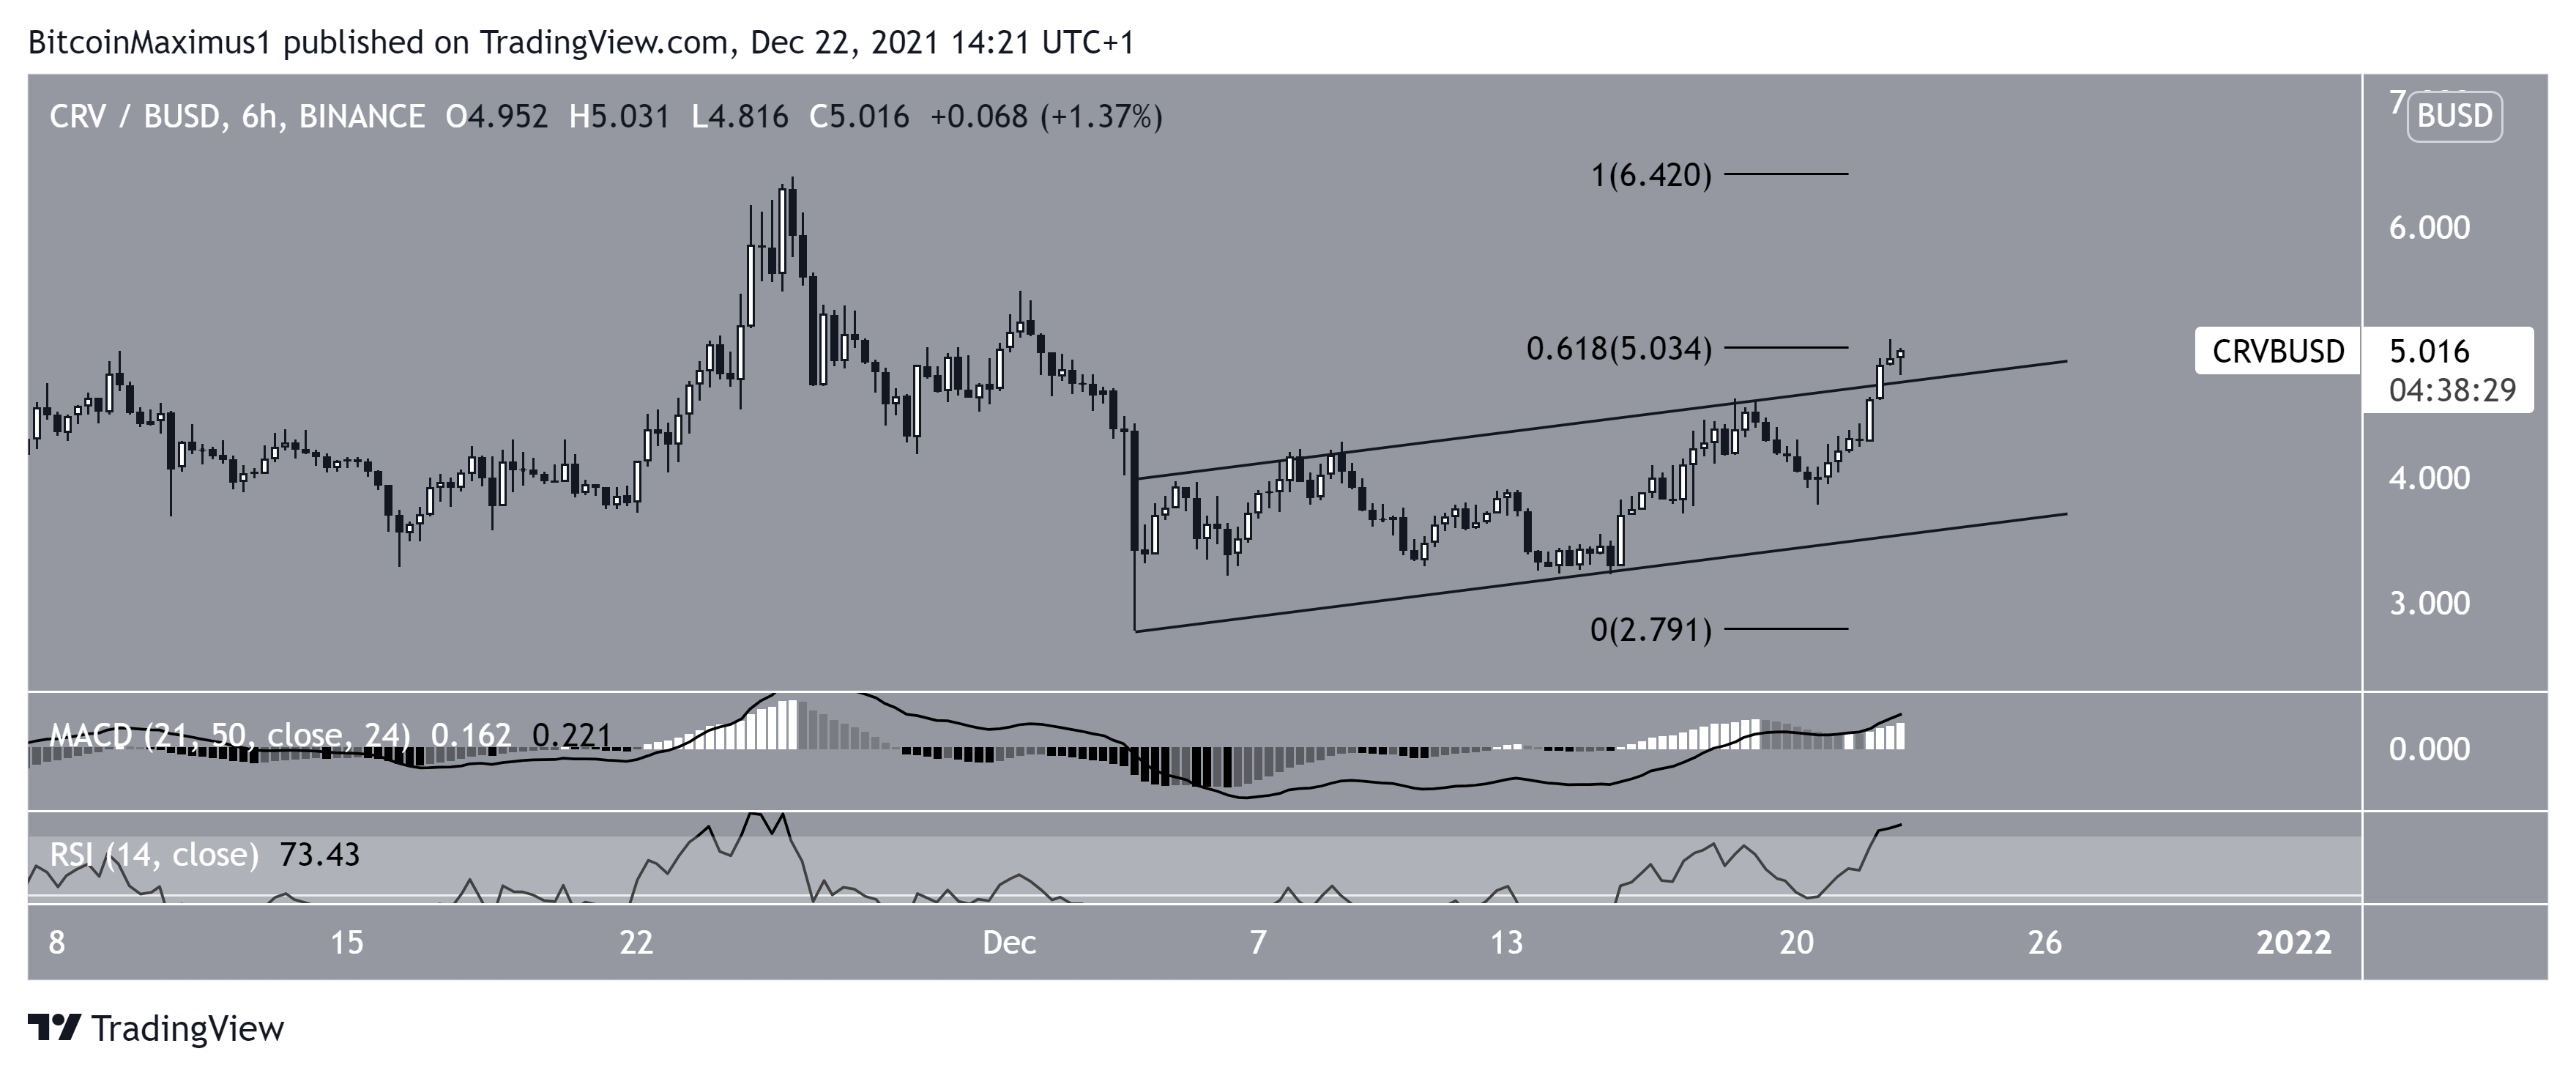
Short-term breakout
The six-hour chart shows that CRV has broken out from a short-term ascending parallel channel.
Currently, it is facing resistance at $5.20, created by the 0.618 Fib retracement resistance level.
Once it manages to move above this level, there is no more resistance left until the all-time high price.
Similarly to the daily time-frame, both the MACD and RSI are increasing, supporting the continuation of the upward movement.
Chart By TradingView
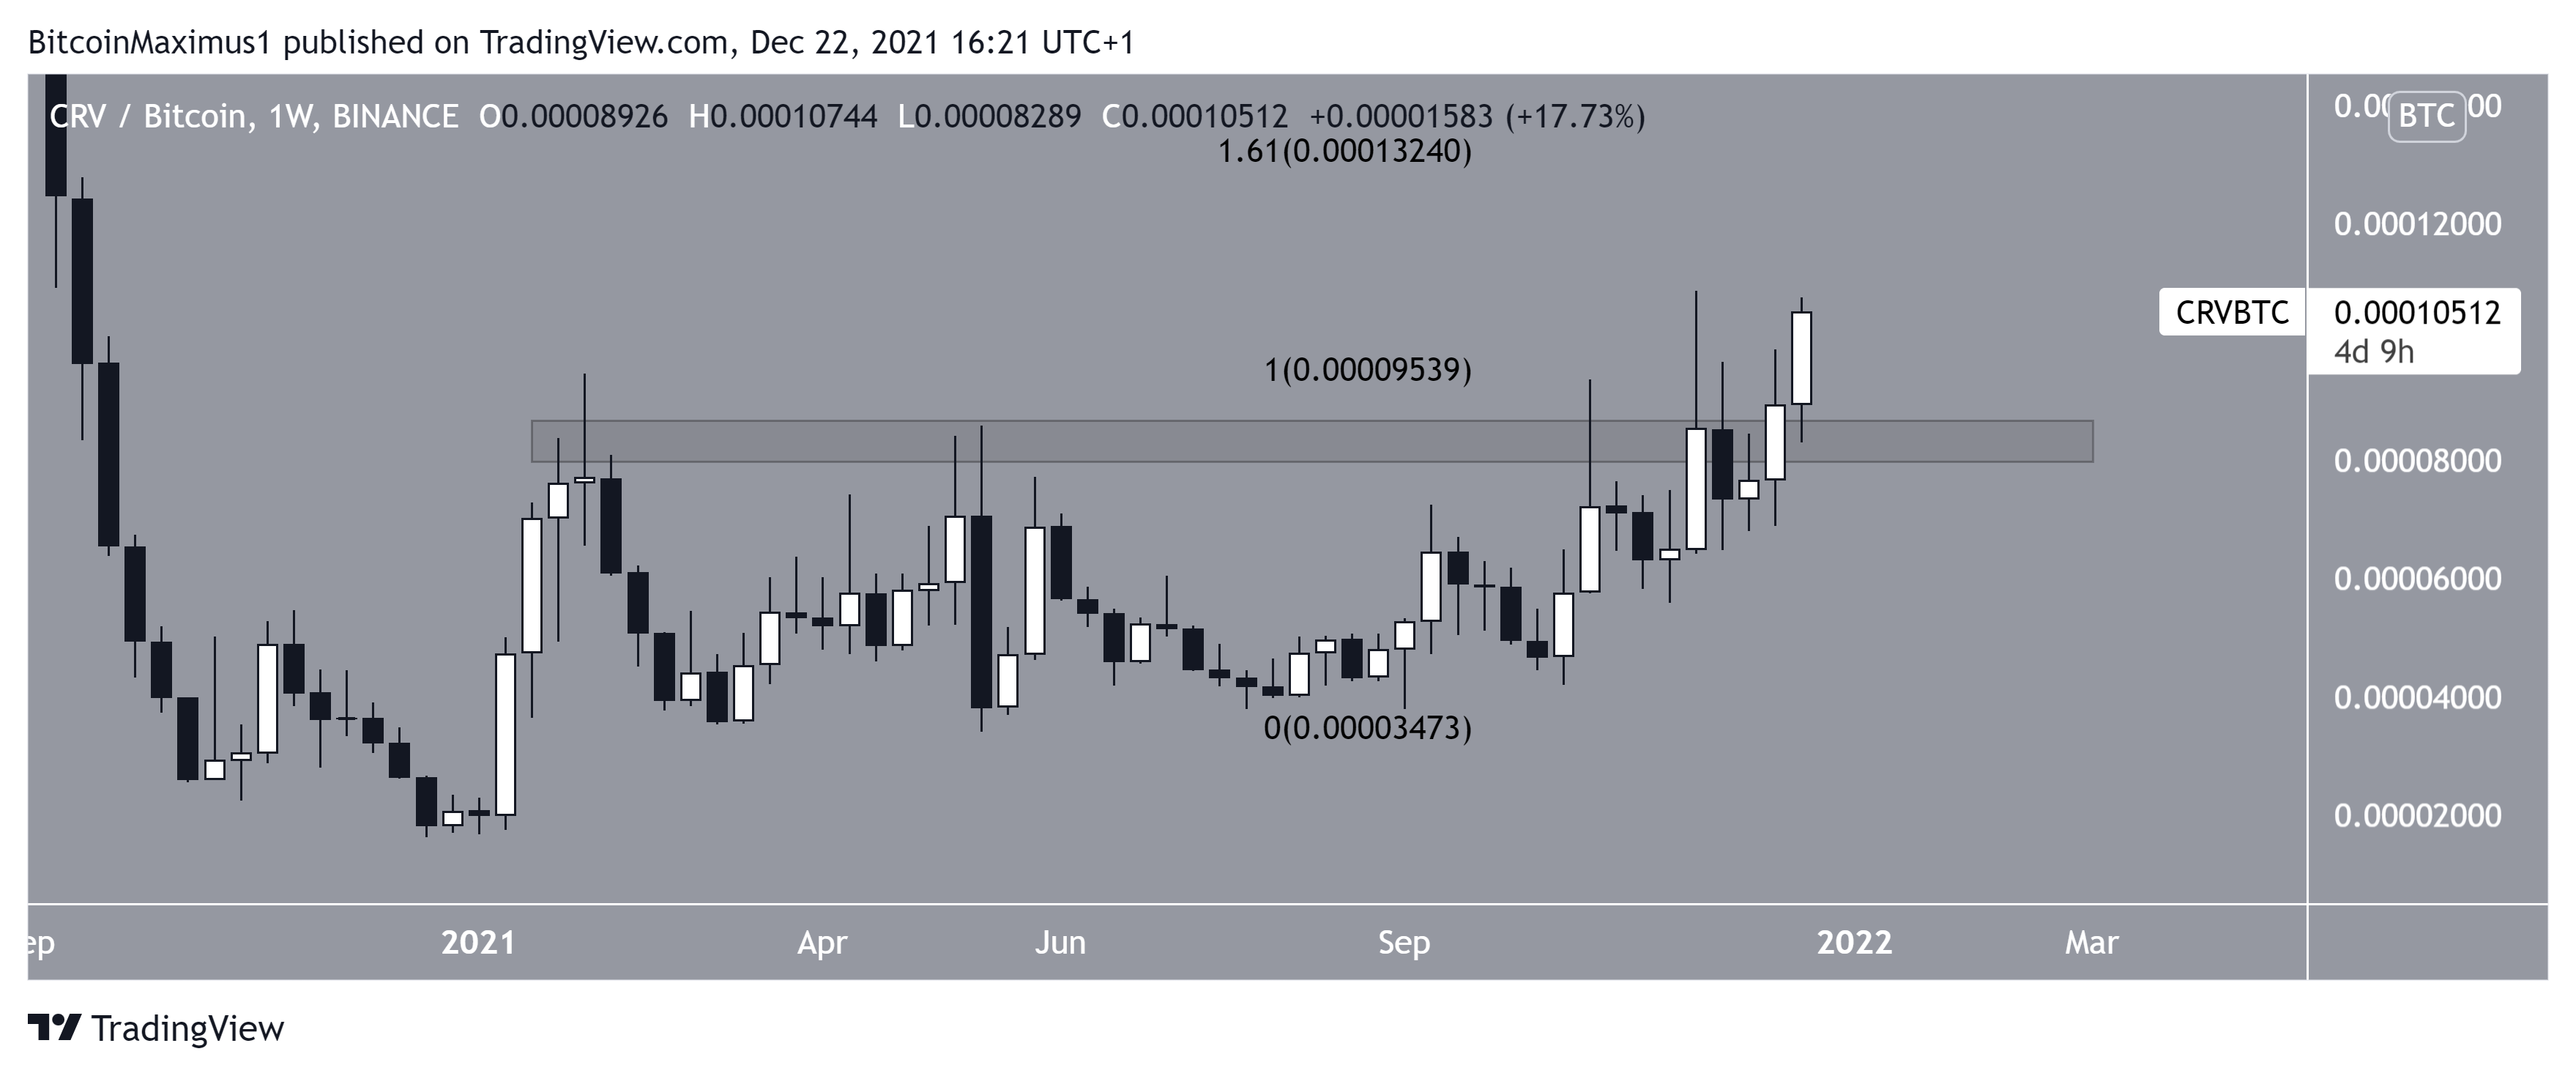
CRV/BTC
The CRV/BTC chart is also bullish. The token has moved above the 8,350 satoshi resistance area, which previously acted as resistance since the beginning of the year.
If the token continues moving upwards, the next closest resistance area would be at 12,350 satoshis, created by the 1.61 external Fib retracement level when measuring the most recent portion of the drop.
Chart By TradingViewFor BeInCrypto’s latest Bitcoin (BTC) analysis, click here
Disclaimer
All the information contained on our website is published in good faith and for general information purposes only. Any action the reader takes upon the information found on our website is strictly at their own risk.