
With Ethereum (ETH) expected to complete the Merge around Sept 15-16, the price has been increasing at an accelerated rate since July 26.
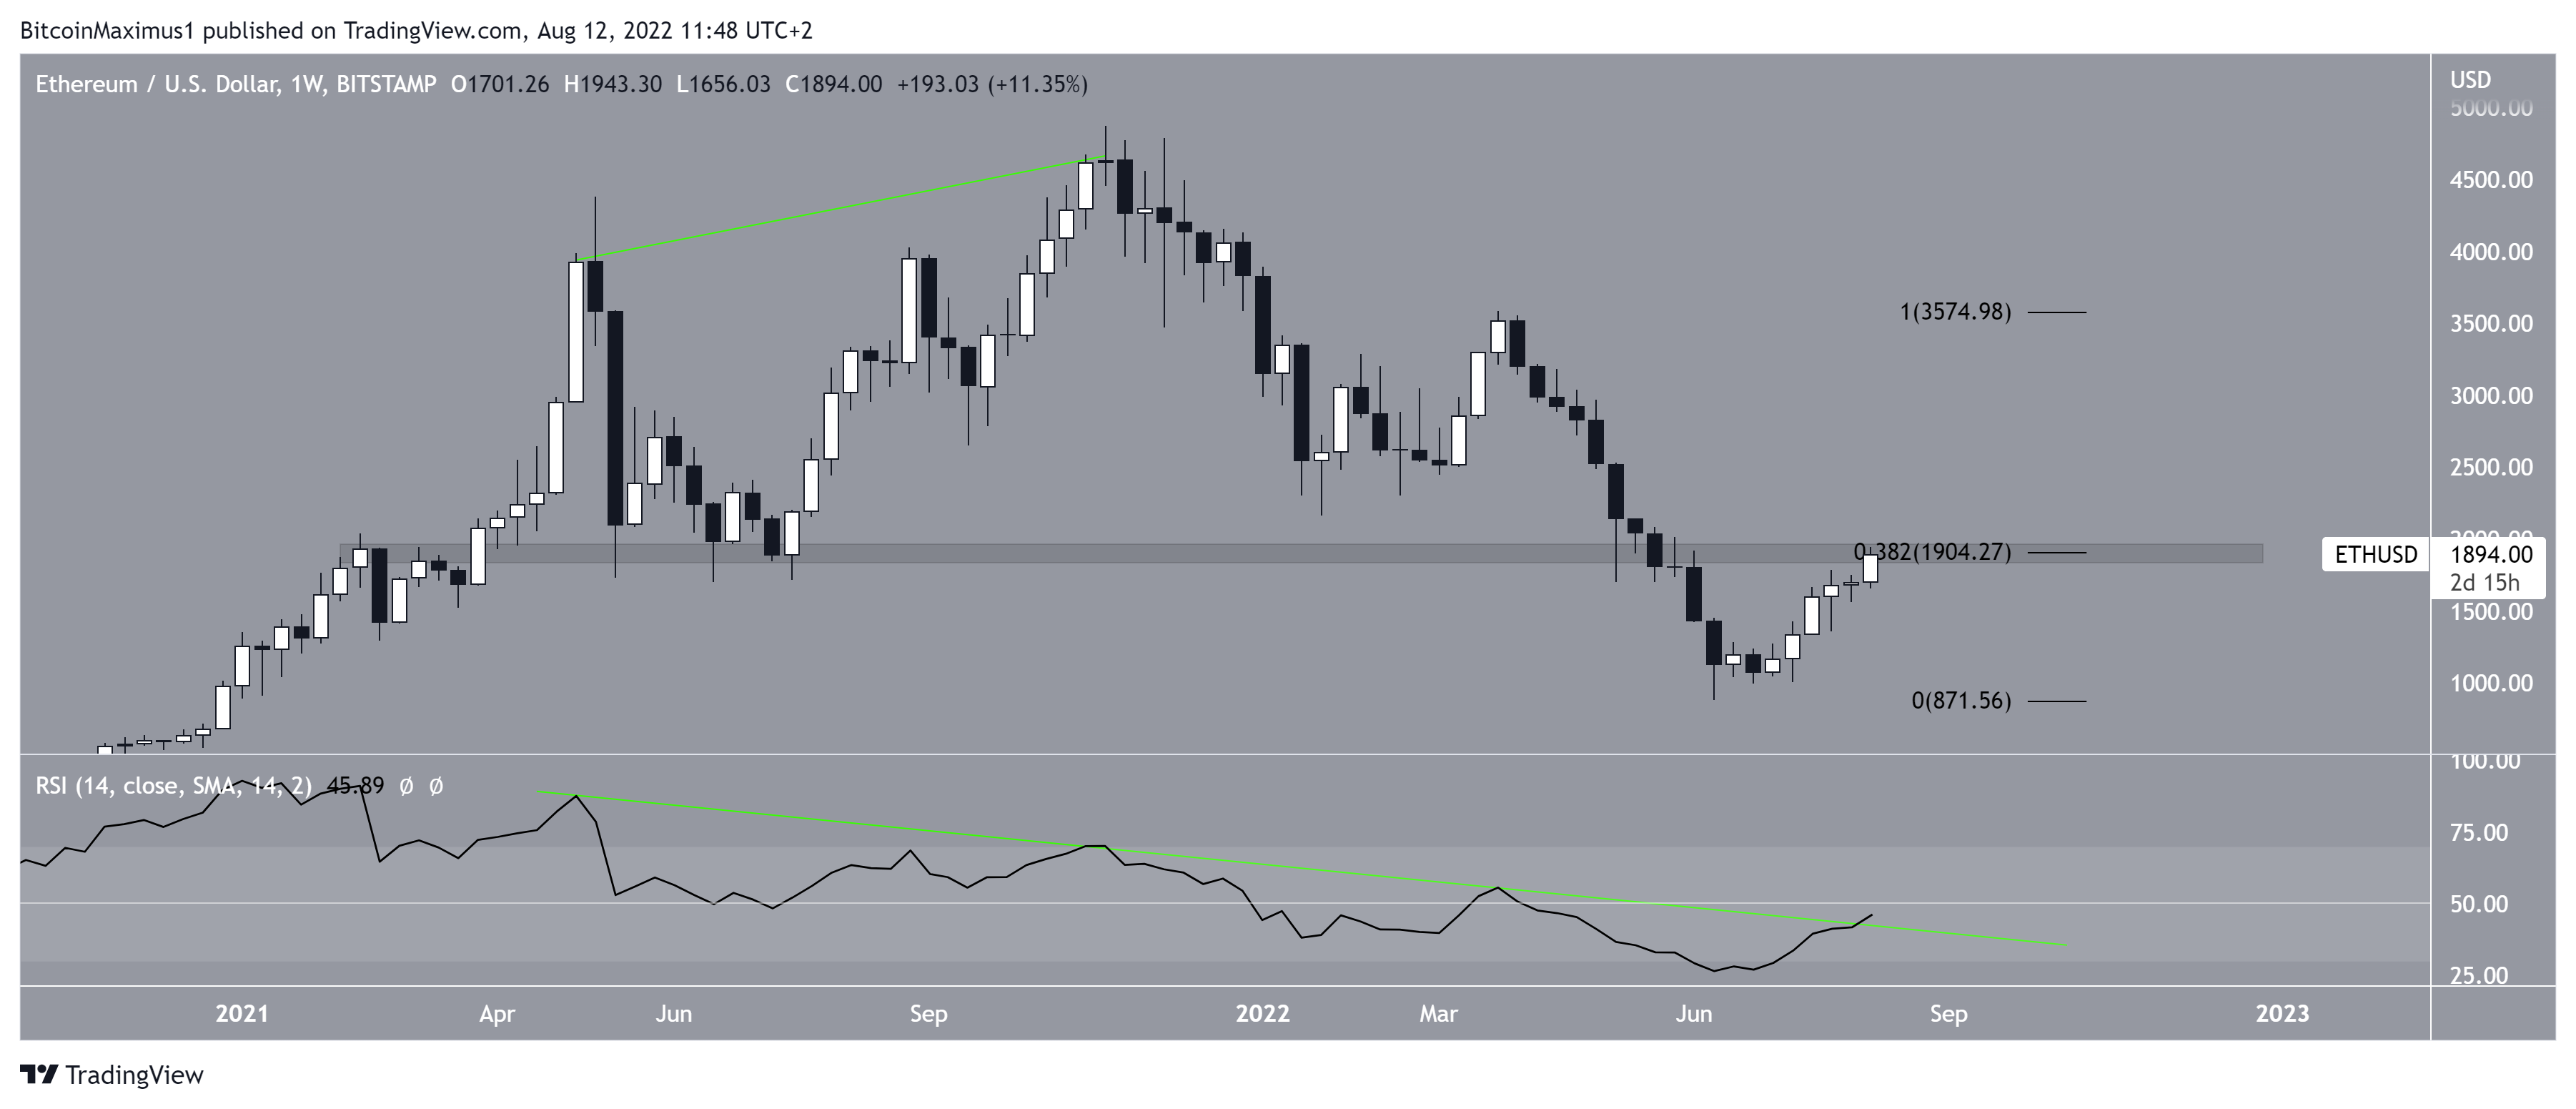
ETH has been increasing since reaching a low of $880 on June 18. So far, it has reached a high of $1,943 on Aug 11.
The upward movement took it to the $1,905 area. This is a crucial area since it had previously acted as support since April 2021. So, it is now likely to act as resistance. Moreover, the area also coincides with the 0.382 Fib retracement resistance level when measuring the previous decrease.
Interestingly, the weekly RSI is in the process of breaking out from its bearish divergence trend line (green line). If this occurs along with a reclaim of the $1,905 area, it would confirm that a long-term bullish reversal is in place.
Ongoing ETH breakout
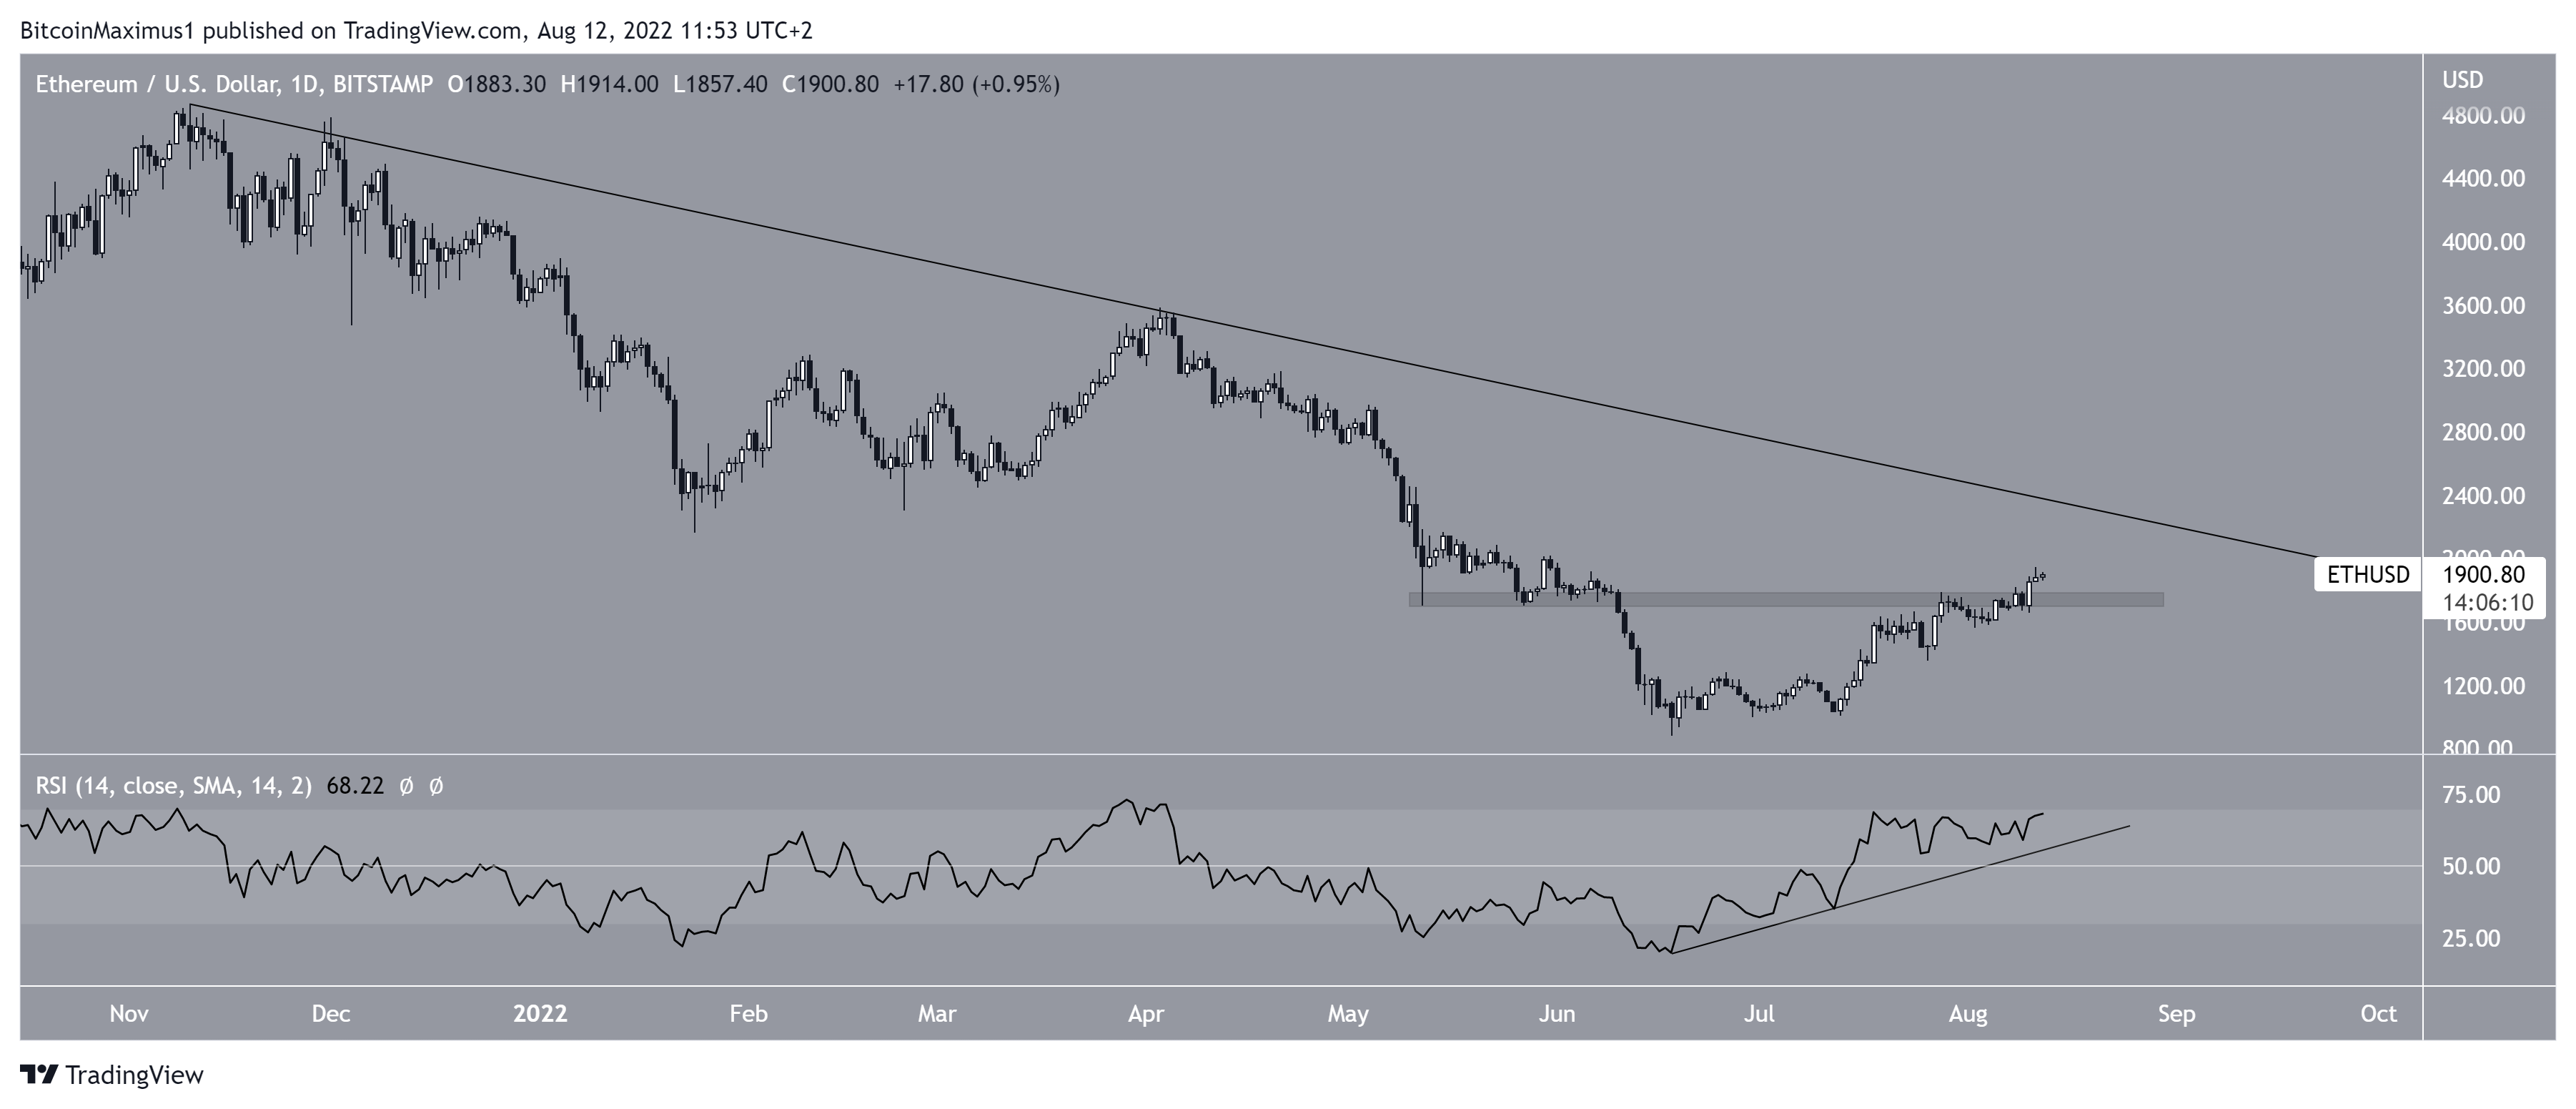
The daily chart supports the continuation of the upward movement. During its increase, Ethereum has reclaimed the minor $1,750 area and validated it as support.
Furthermore, the daily RSI has moved above 50 and is following an ascending support line.
If the upward movement continues, there is a long-term descending resistance line close to $2,100.
Therefore, the daily time frame suggests that there is no considerable resistance until $2,100.
Wave count analysis
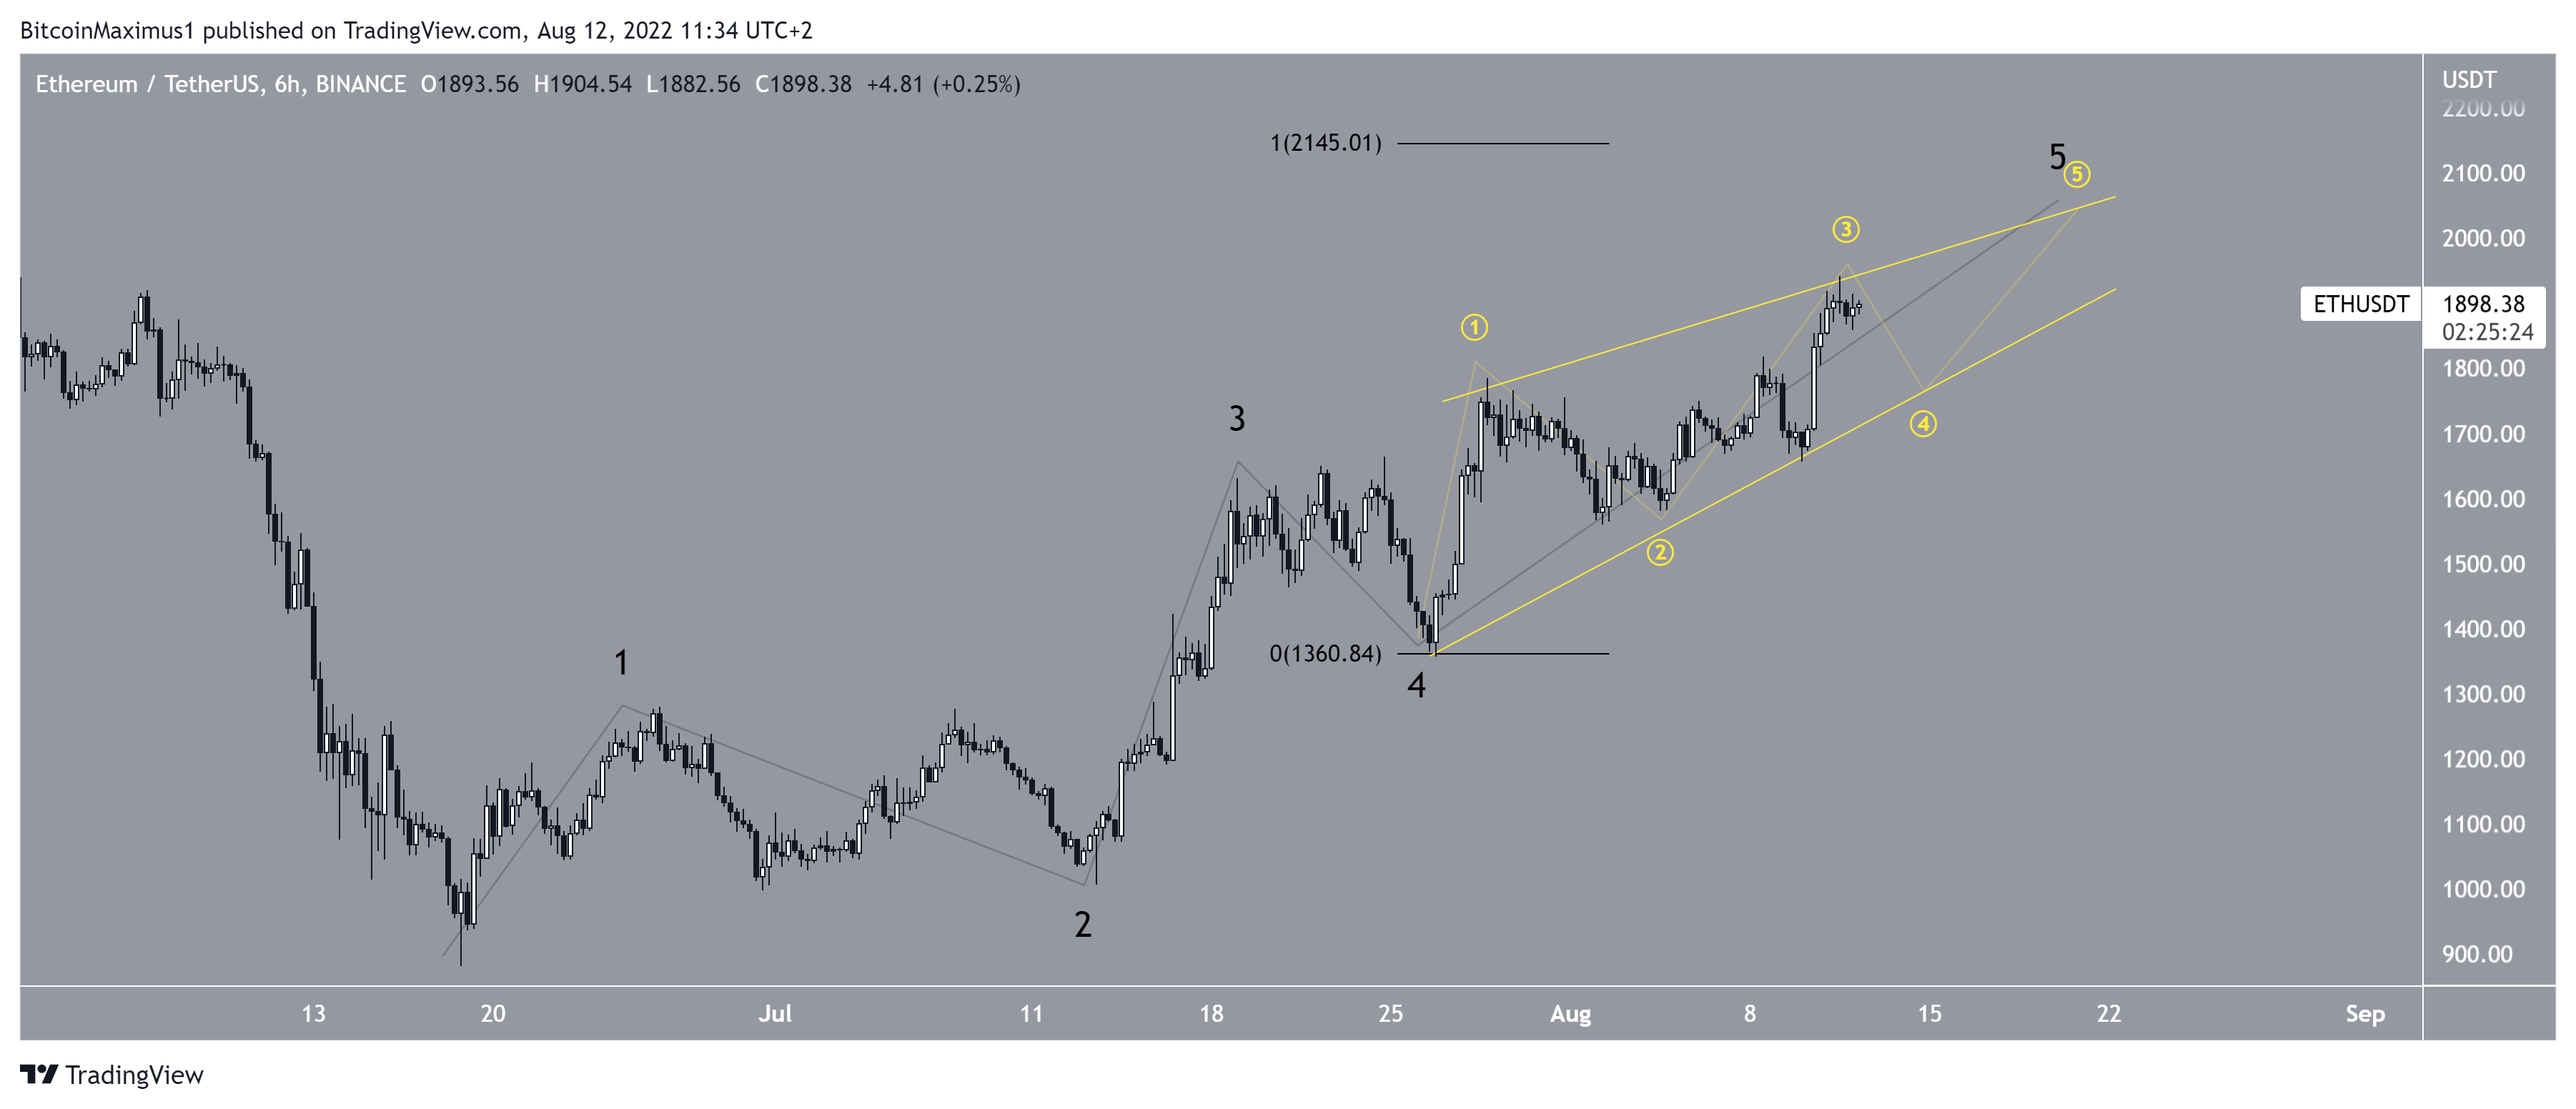
The wave count suggests that ETH began a five-wave upward movement in June. If so, it is currently in the fifth and final wave. The sub-wave count is shown in yellow, suggesting that the movement has taken the shape of an ending diagonal.
A potential target for the top of the movement is at $2,145, which would give wave five the length of waves one and three combined (black). This would also coincide with the previously mentioned resistance line.
The long-term count is also bullish and supports the possibility that a bottom has been reached.
For Be[in]Crypto’s latest Bitcoin (BTC) analysis, click here