In this article, Be[in]Crypto takes a look at the price movement of Bitcoin (BTC), the dollar index (DXY), and the S&P 500 (SPX) to determine if they correlate with each other.
S&P 500
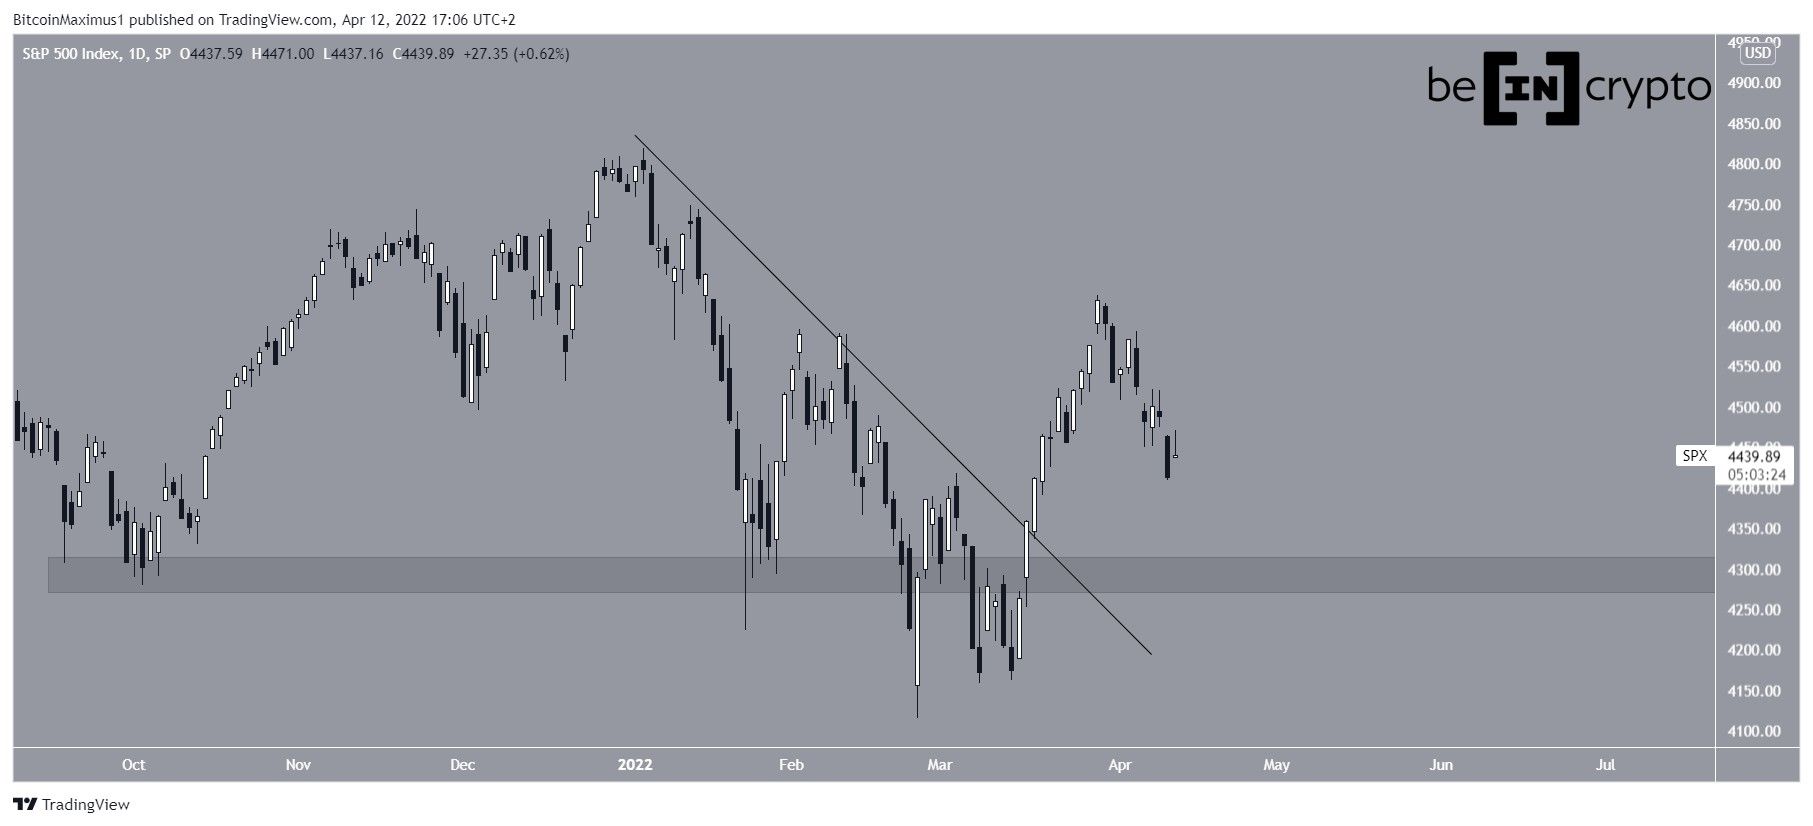
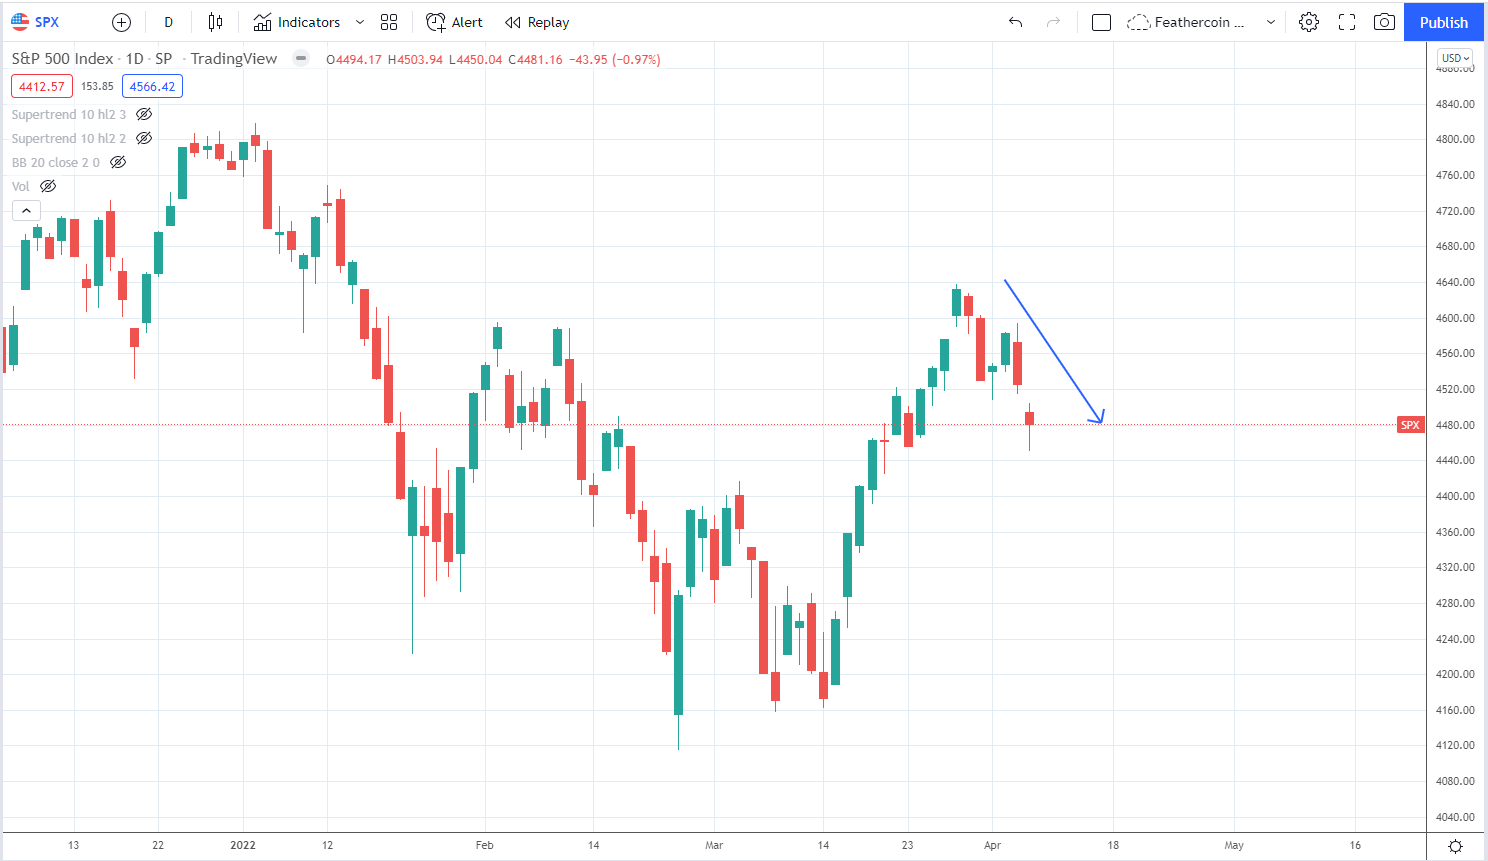
SPX has been falling since reaching an all-time high of $4,818 on Jan 4. The downward movement led to a low of $4,114 on Feb 24.
Afterward, the index bounced and broke out from a descending resistance line on March 17. This upward movement led to a high of $4,637 on March 29.
SPX has been falling since and is potentially returning to the $4,300 area once more. The area is expected to provide support.
Correlation to BTC
Market analyst @Incomesharks tweeted a chart of SPX, suggesting that its drop is responsible for the drop in BTC.
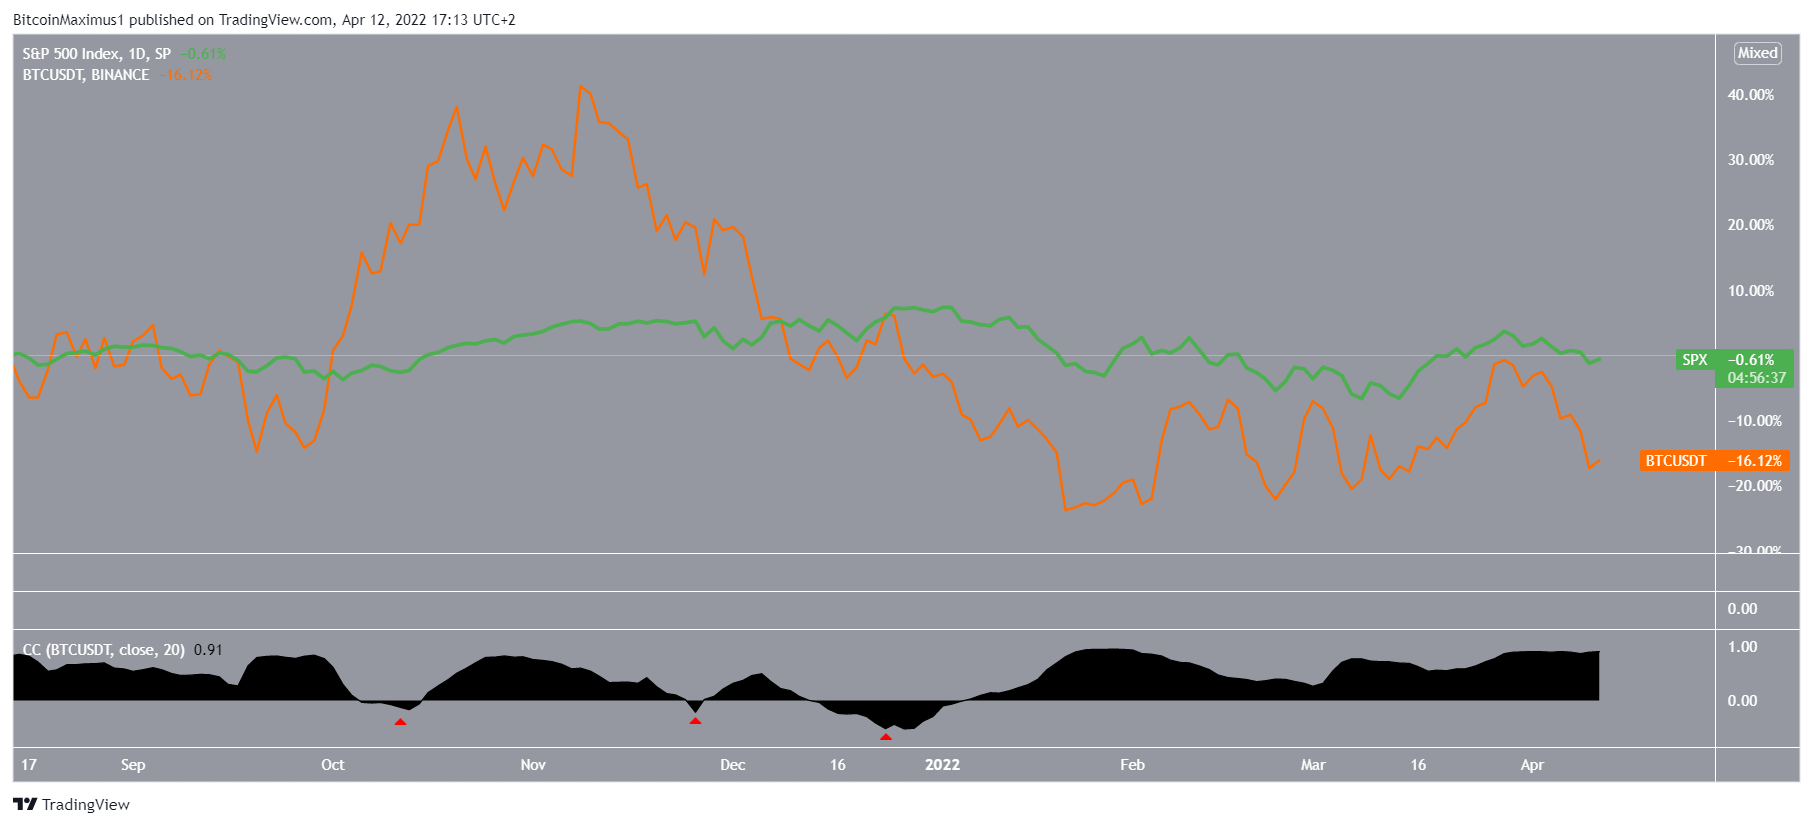
When comparing the SPX (green) movement to that of BTC (orange), it is visible that they are very similar, with the exception that the BTC movement has transpired at a much larger magnitude.
As seen by the correlation coefficient (black), both assets are highly positively correlated. This means that an increase in one is causing an increase in the other. There have been three periods (red icons) in which the correlation is negative, however, they were short-lived.
Since the beginning of 2022, the correlation has been close to 1, suggesting a perfect correlation between the two.
Dollar index
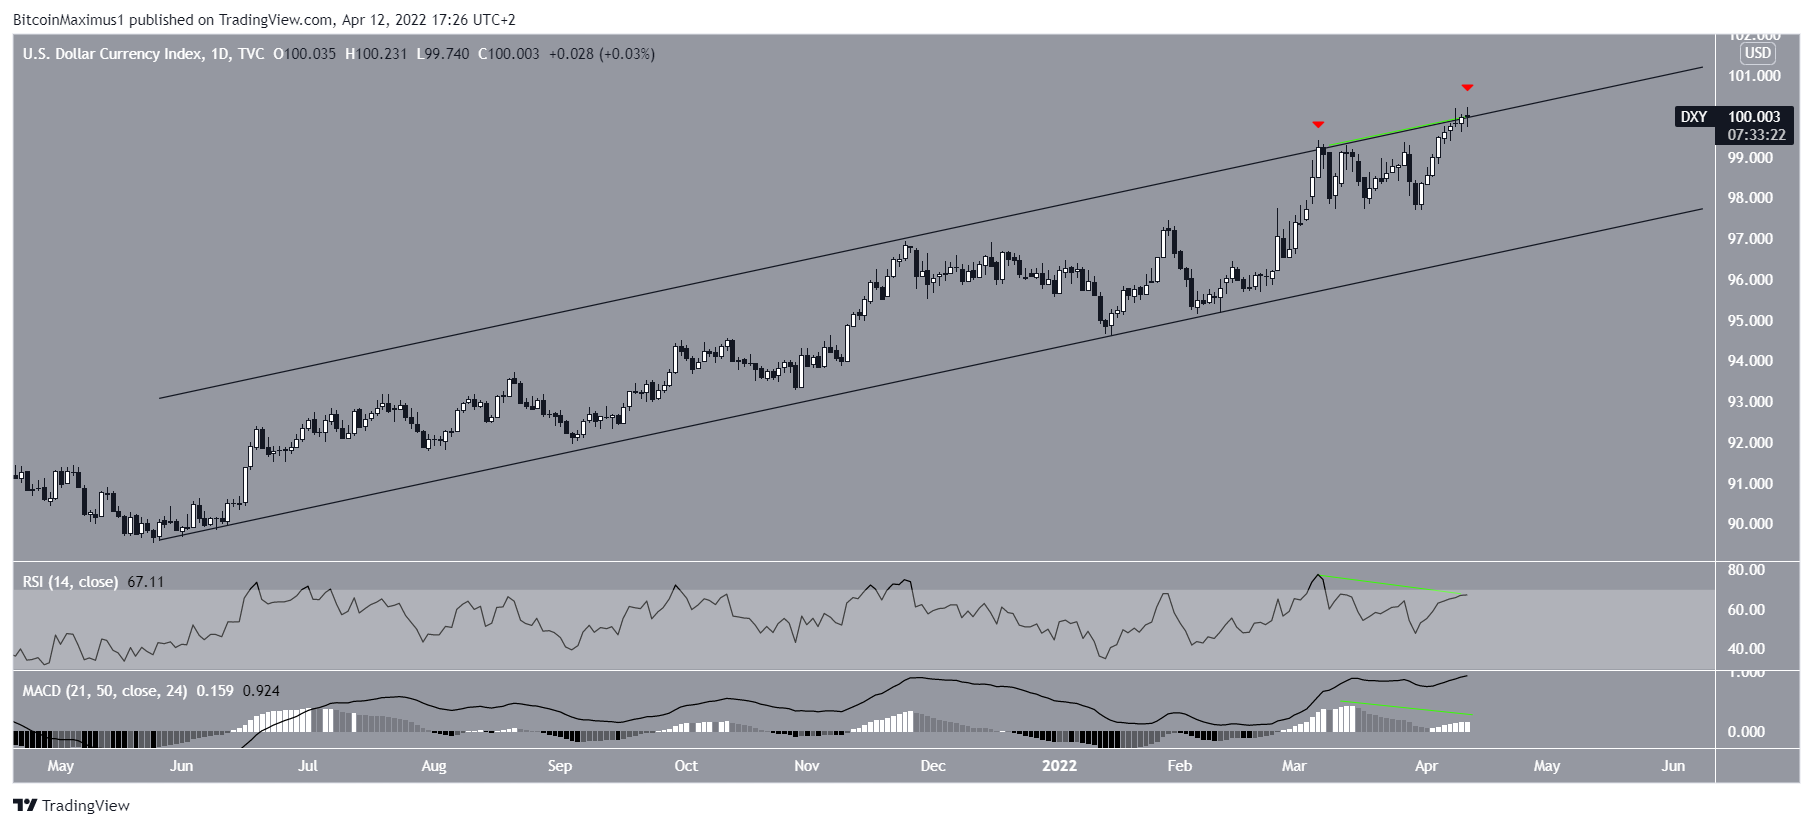
The DXY has been increasing inside an ascending parallel channel since the beginning of May. The upward movement is still ongoing, leading to a high of $100.23 on April 12.
However, DXY has been rejected twice by the resistance line of the channel (red icons). Furthermore, there is some weakness developing in the form of bearish divergence (green lines) in both the RSI and MACD.
Therefore, it is possible that a short-term drop will follow.
Correlation to BTC
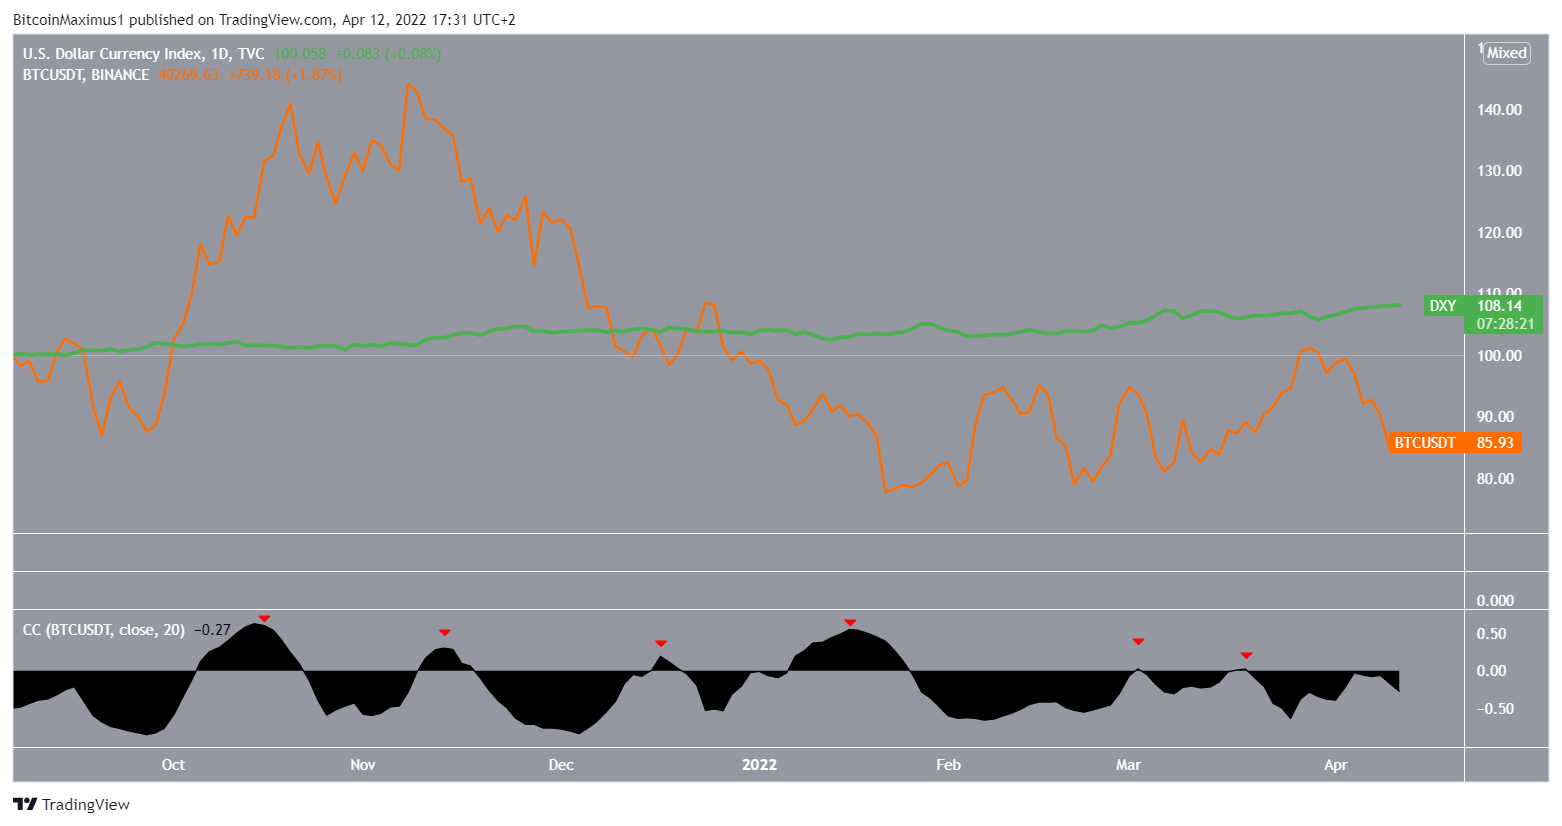
When comparing the movement of DXY (green) and BTC (orange) there is a predominantly negative correlation. Since Oct 2021, there are six periods (red icons) in which the correlation briefly turned positive.
In addition to this, the correlation coefficient rarely drops below -0.5, implying a less than perfect correlation.
Therefore, the correlation is not as strong as that between the SPX and BTC.
For Be[in]Crypto’s latest Bitcoin (BTC) analysis, click here