Solana (SOL) has broken out from a long-term resistance line and is attempting to create the final portion of a bullish pattern.
Solana is gradually becoming one of the most important decentralized finance (DeFi) ecosystems in the cryptocurrency industry. On Wednesday, two well-known projects in the Solana Network, Alfprotocol and Soldex announced a partnership.
Alfprotocol is a DeFi platform that offers leveraged and unleveraged trading and yield farming to its participants. Soldex is a community driven trading platform that aims to address issues associated with decentralized exchanges (DEXs), such as liquidity, small volumes and slow transaction speeds.
The partnership further solidifies the role of the Solana DeFi ecosystem in the industry and positions Alfprotocol as a gateway to this ecosystem.
While this pattern has had a positive effect in the short-term price, the long-term trend is still unclear.
Double bottom pattern
SOL had been decreasing underneath a descending resistance line since reaching an all-time high price of $260 in Nov 2021. The downward movement led to a low of $25.78 in June.
The price has been increasing since and managed to break out from the line on Aug 6. At the time of the breakout, the line had been in place for 273 days. Breakouts from such long-term structures are usually a sign of a bullish trend reversal.
However, the price did not sustain its upward movement after the breakout. On the contrary, it decreased in order to validate the line as support. This is still a customary movement that does occur after breakouts.
More importantly, SOL seems to be in the process of creating a double bottom, which is considered a bullish pattern. Moreover, the double bottom has been combined with bullish divergence in the weekly RSI (green lines). Such divergences often precede significant upward movements. Therefore, the divergence increases the validity of the breakout.
If an upward movement follows, the closest resistance areas would be at $80 and $115 respectively.

Future SOL movement
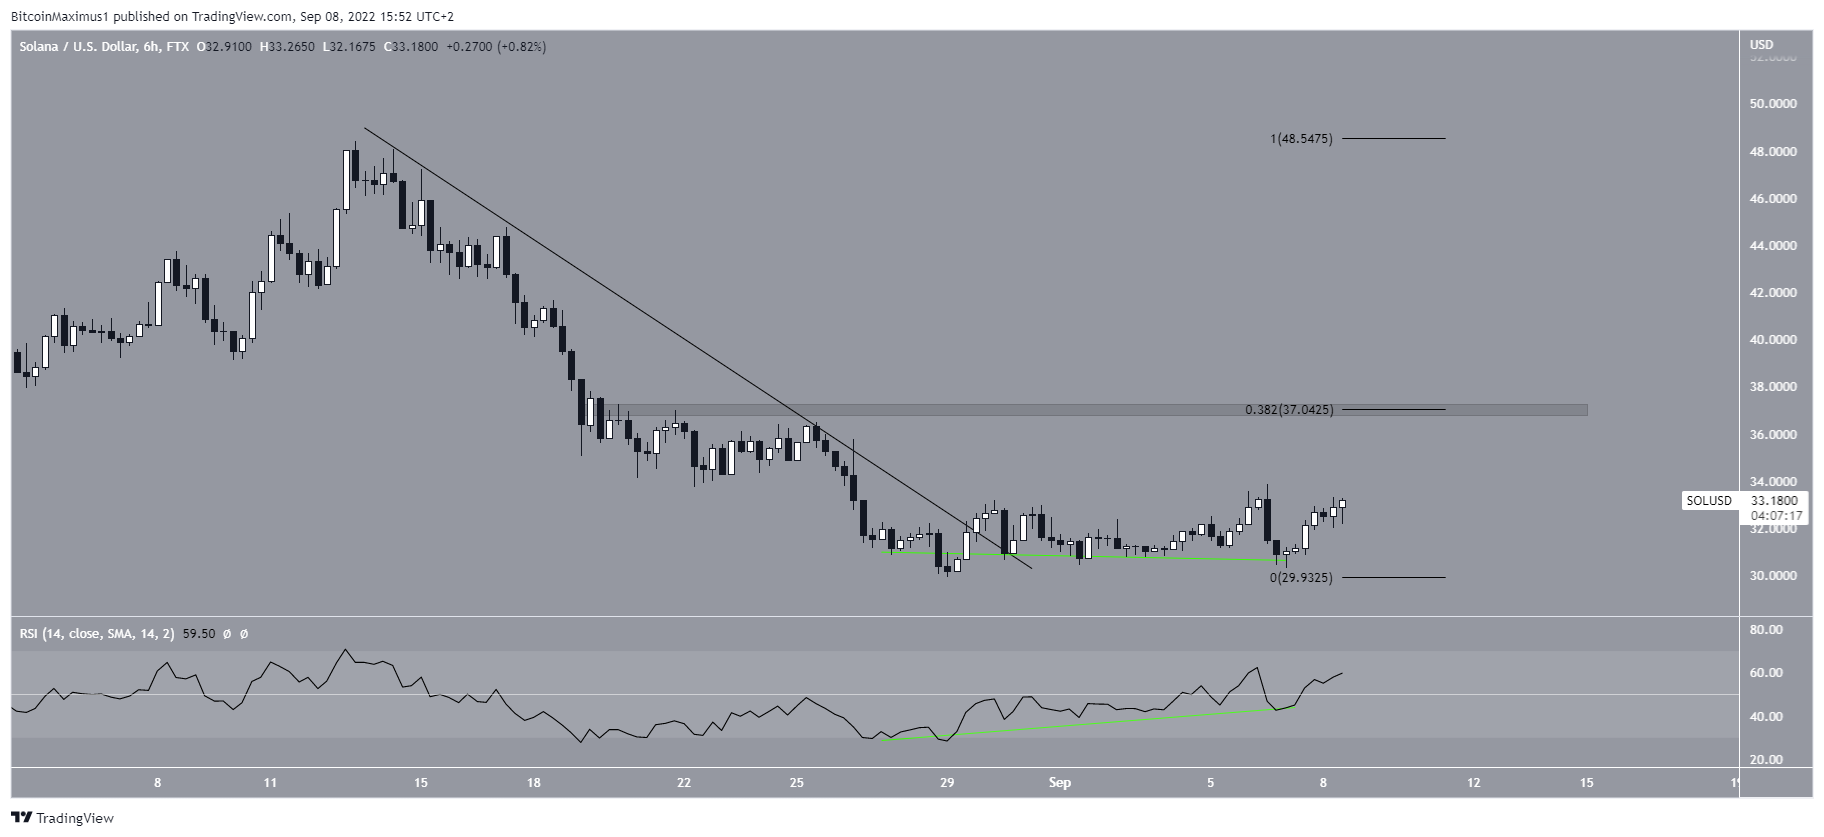
The six-hour chart supports the continuation of the upward movement and in turn the validation of the double bottom pattern. There are two reasons for this.
Firstly, the price has broken out from a descending resistance line. Secondly, the six-hour RSI has generated bullish divergence (green line). So, these two readings support the continuation of the upward movement.
The first resistance area is at $37, created by the 0.382 Fib retracement resistance level and a horizontal resistance area. A movement above this area would go a long way in confirming that SOL has initiated a bullish trend reversal.
For Be[in]Crypto’s latest Bitcoin (BTC) analysis, click here