
April 20 marked an unprecedented event for the oil price, whose futures at one point traded at negative prices.
While the price has rebounded since, opening at $20 the next day, the 99.99% daily decrease cannot be ignored and could have an effect on the market at large. Well-known trader @Skewdotcom outlined a chart showing that the Bitcoin price has fallen back below $7,000, after trading above this level for several days. He suggests that this decrease was caused by oil-related anxiety, due to the aforementioned rapid crash in the oil price.

In this article, we will take a closer look at the price of both BTC and oil, attempting to analyze their correlation and see if yesterday’s decrease was really caused by the oil crash.
Correlation
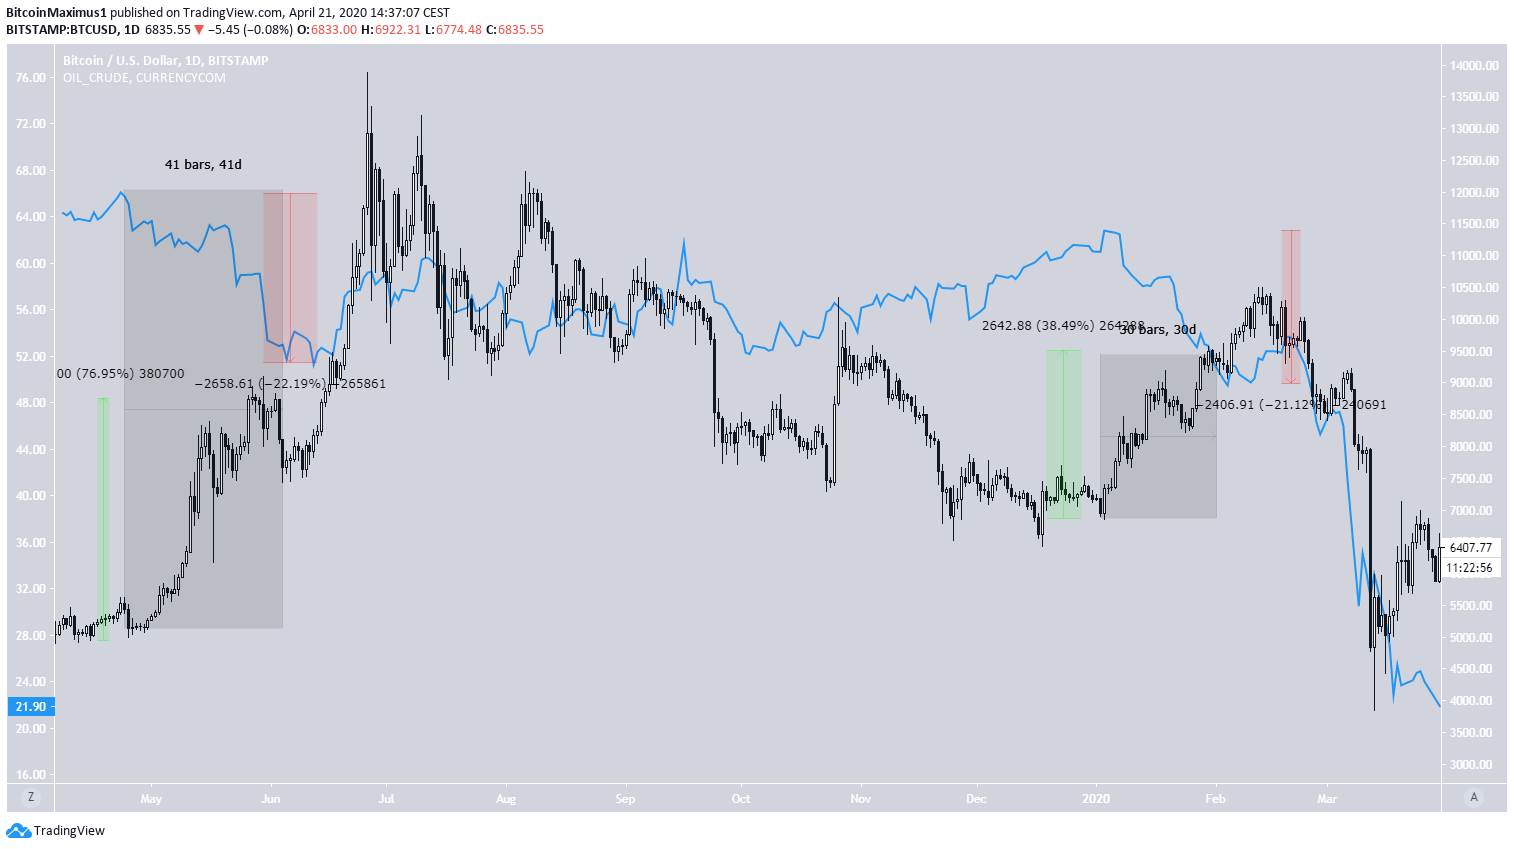
The prices of BTC and oil have not always been correlated, at least since the beginning of 2019. There are two periods that show the biggest divide between the trend of each: a 41-day period between April and June 2019 and a 30-day period between January and March 2020.
During the 2019 period, the BTC price increased by 77% while at the same time oil fell by 22%.
In the 2020 period, the BTC price increased by 39% while the oil price fell by 21%.
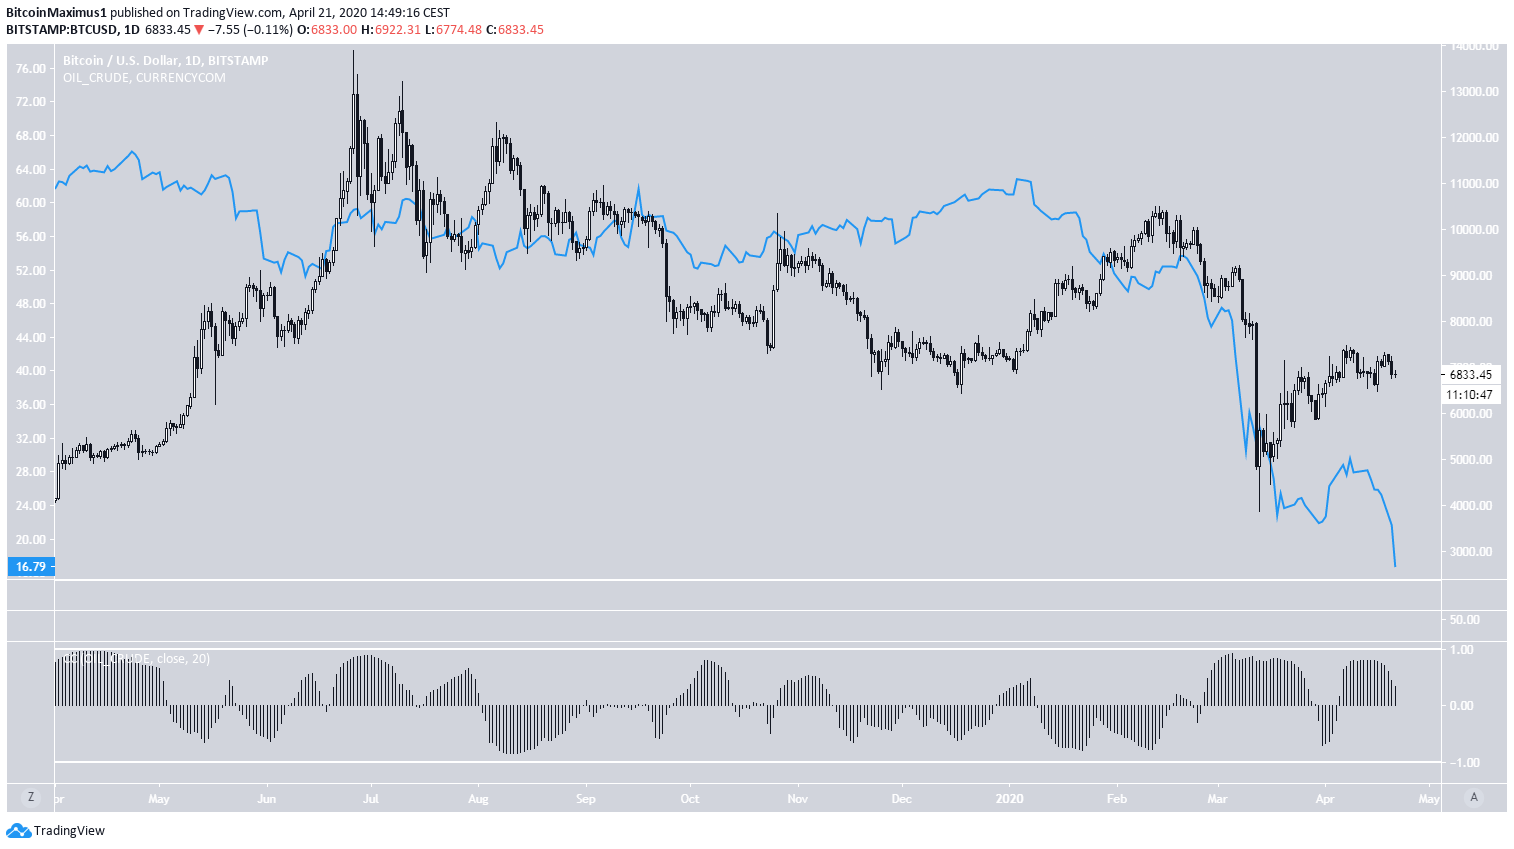
Throughout the rest of the time period analyzed, the BTC and oil prices have had a relatively similar movement, albeit with a different magnitude. However, the movement is not sufficiently similar to call it a correlation.
This is better illustrated when incorporating the correlation coefficient, shown as a black histogram in the chart below.
A value of 1 indicates perfect correlation while that of -1 indicates no correlation at all. The correlation between BTC and oil has moved from 0.92 to -0.88, indicating that there have been periods of almost perfect correlation alongside periods of almost no correlation at all.
April 20 Decrease
The April 20 decrease was absolutely massive. At one point, the oil price had decreased by 99.99%. Even though we found no long-term correlation, a decrease of this magnitude could surely have an effect on the BTC price.
However, when looking at the hourly chart, we can see that the initial BTC decrease from $7,200 to $6,900 occurred while the oil price decreased from $15 to $13. The ensuing oil decrease, which took the price all the way to $0.01, occurred several hours after, when the BTC price was already below $7,000.
In fact, we predicted the BTC decrease successfully without looking at the oil price, focusing solely on the BTC price movement.

To conclude, even though the oil price decreased considerably yesterday, there is no conclusive evidence to suggest that the oil price crash was the instigator for the BTC price decrease below $7,000.