
In today’s on-chain analysis, Be[In]Crypto looks at the Puell Multiple indicator to determine whether Bitcoin (BTC) has already reached the bottom of the ongoing bear market. Historical data suggests that the indicator is currently in a buying area.
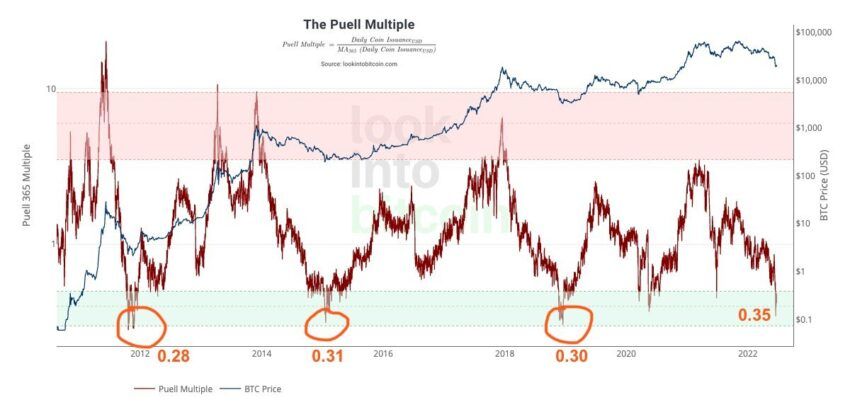
The Puell Multiple, created by analyst David Puell, is one indicator of the health of Bitcoin miners. It is calculated by dividing the daily issuance value of Bitcoins (in USD) by the 365-day moving average of daily issuance value. It provides a powerful and elegant tool for assessing market cycles from the perspective of miners’ profitability.
Performance of Puell Multiple with BTC cycles
If we look at the entire history of BTC trading, we see that the Puell Multiple has proven to be very accurate in trying to estimate the peaks and bottoms of Bitcoin’s historical cycles. Three areas are marked on the long-term chart from Glassnode:
- green/buying: the range of 0.3-0.5
- white/neutral: the range of 0.5-4
- red/selling: the range of 4-10
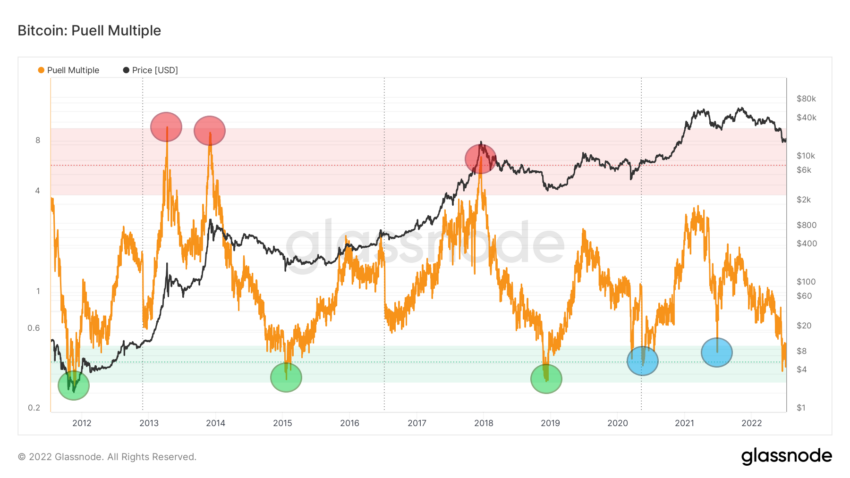
In three cases of historical price peaks (red circles) and in three cases of bottoms (green circles), the indicator indicated the extremes with great accuracy. In addition, it visited the green buying area twice more. This happened during and immediately after the COVID-19 crash in March-April 2020 and at the bottom of the summer 2021 correction (blue circles).
Interestingly, the market peaks of 2021 did not see the confirmation of the Puell Multiple. During the setting of the all-time high (ATH) at $64,900 in April 2021, the indicator reached a value of 3.22, while during the most recent ATH at $69,000 in Nov 2021 it was only 1.6.
Current readings
The current reading of the Puell Multiple recorded a low of 0.35 on June 17 and 0.37 on July 5. These are the lowest values since Dec 2018, when Bitcoin was at the bottom of the previous bear market near $3,250.
It is worth mentioning that both the aforementioned COVID-19 crash and the May 2021 correction did not bring the Puell Multiple to such low levels.
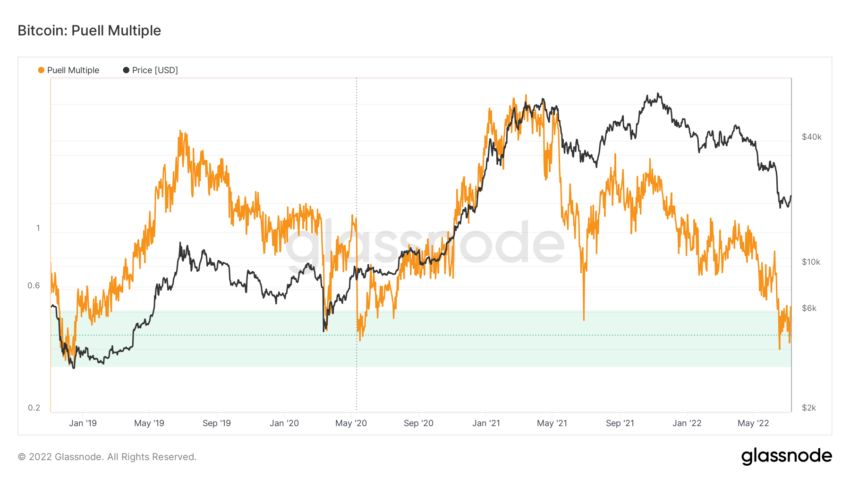
Historically, the indicator stayed in the green, buying area for about one to three months before leaving it and signaling the beginning of a bull market. Currently, it has been there for about a month since mid-June. It suggests that while this is a good level for the start of a dollar cost average (DCA) buying, we may be in for another test of lower levels.
This is also the conclusion reached by analyst @TheChainRN, who tweeted his interpretation of the Puell Multiple. He claims that at the lows of the previous bear markets, the indicator reached levels in the range of 0.28-0.31. Therefore, with current readings at 0.35, the market may be waiting for one more decline, in which the Puell Multiple will reach historic lows.
For Be[in]Crypto’s latest Bitcoin (BTC) analysis, click here.