
Bitcoin on-chain metrics and technical indicators are breaking new grounds as bottom signals mount up, but the gloomy global macroeconomic situation is keeping buyers at bay.
In its weekly on-chain report, analytics firm Glassnode has taken a deep dive into the mounting metrics that suggest bitcoin prices are near the bottom of this current market cycle.
The month of June has been historically volatile for BTC, it noted, and this June has stayed true to the trend, with the asset tanking more than 35% since the beginning of the month.
Glassnode concluded that based on the current BTC prices relative to historical floor models:
“The market is already at an extremely improbable level, with only 0.2% of trading days being in similar circumstances.”
At the time of writing, BTC had dropped 2.3% on the day to trade at $20,684, 70% down from its Nov peak.
Bitcoin bottom indicators flashing
As reported by Be[In]Crypto yesterday, several significant technical indicators were signaling that markets are close to the bottom, but buyers are few and far between.
Glassnode has reconfirmed this with a raft of on-chain analytics and previously used models that show BTC prices are close to historical floor models.
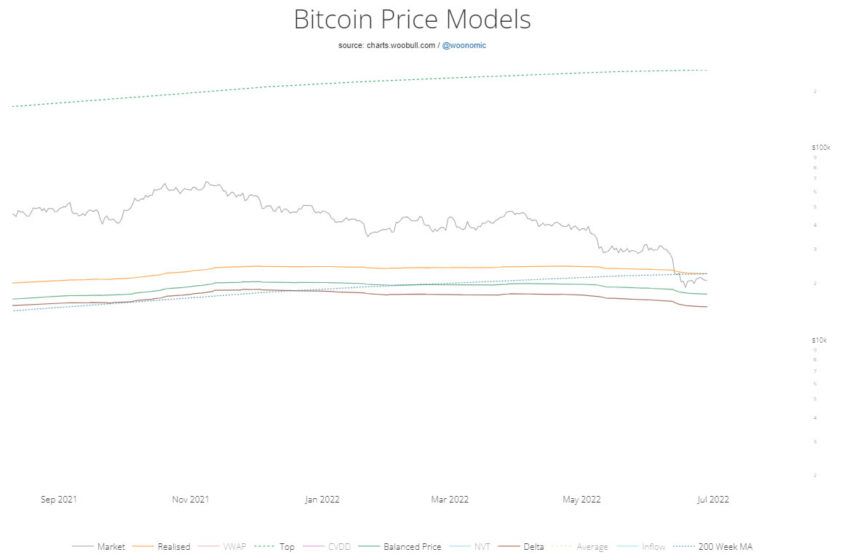
The Mayer Multiple is the multiple of the current bitcoin price over the 200-day moving average. It is currently trading at a discount of 0.54 according to Woobull’s live chart, which has only happened a few times in its history.
Bitcoin Realized Price is the aggregate cost basis of the supply. It typically provides resistance areas during bottom formation. It is currently trading below the RP of $22,463, and only 14% of all trading days have closed below this level.
The 200-week moving average has been a key level of support in previous bear markets. BTC is currently trading below this level, which is close to its realized price. The close of a monthly candle below the 200-week MA is also unprecedented.
BTC prices are also very close to its Balanced Price, which represents the destruction of coin days, and “reflects a market price that matches the value paid for coins, minus the value ultimately realized.” Only 3% of trading days have closed below this model, Glassnode reported.
Finally, there is the Delta Price, which is the difference between the Realized Price, and the all-time-average price. This level has never been breached and currently stands at $15,099.
Macroeconomic woes deepen
It is unlikely that there will be any significant crypto market recovery or a return to a bull phase until the macroeconomic situation improves. Rampant inflation, soaring energy costs, and a global cost of living crisis are affecting all but the wealthiest. These factors have made this bear cycle different from others that did not have such foreboding overshadows.
There may be a final flush out of weak hands, but markets could well consolidate around these low levels for several months yet.