
The Bitcoin dominance rate (BTCD) has broken down from its long-term bullish structure, while the ETH/BTC chart shows potential for upside.
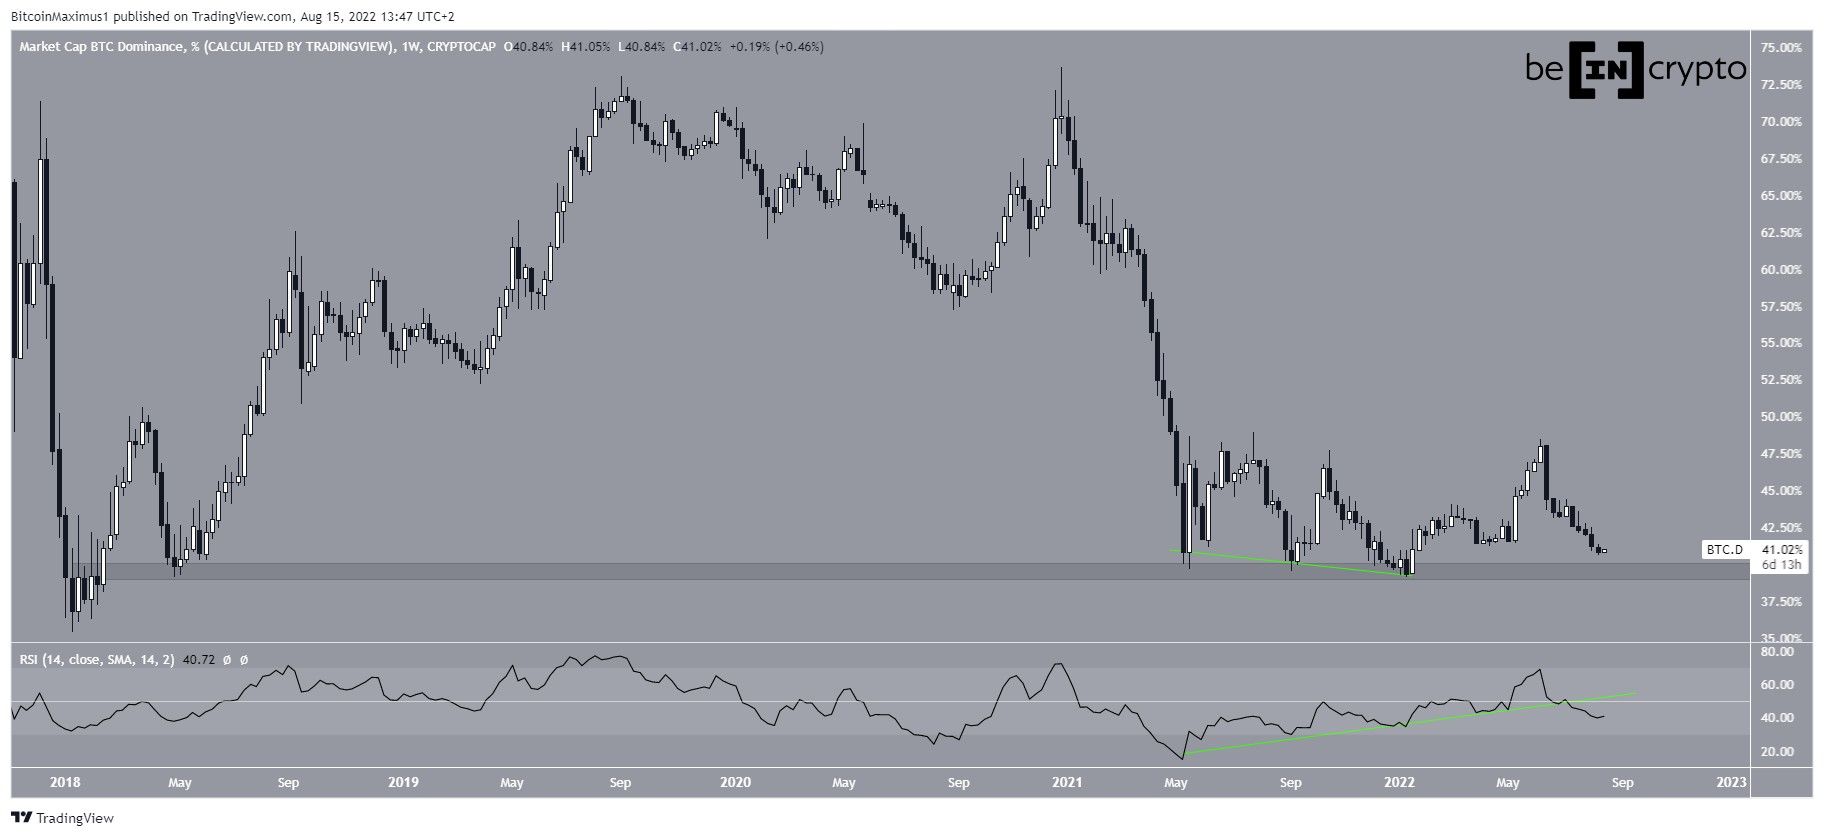
Between May and Dec 2021, BTCD created a triple bottom pattern inside the 39.50% long-term support area. This is considered a bullish pattern, meaning that it usually leads to upward movements. Additionally, the pattern was combined with bullish divergence in the weekly RSI (green line).
While this initially led to an upward movement that took BTCD to a high of 48.45%, the rate has been falling since. Furthermore, it broke down from its bullish divergence trend line and the 50 line at the beginning of Aug.
This suggests that the upward movement might have come to an end. If so, BTCD would be expected to break down from the 39.50% support area.
Potential BTCD bounce
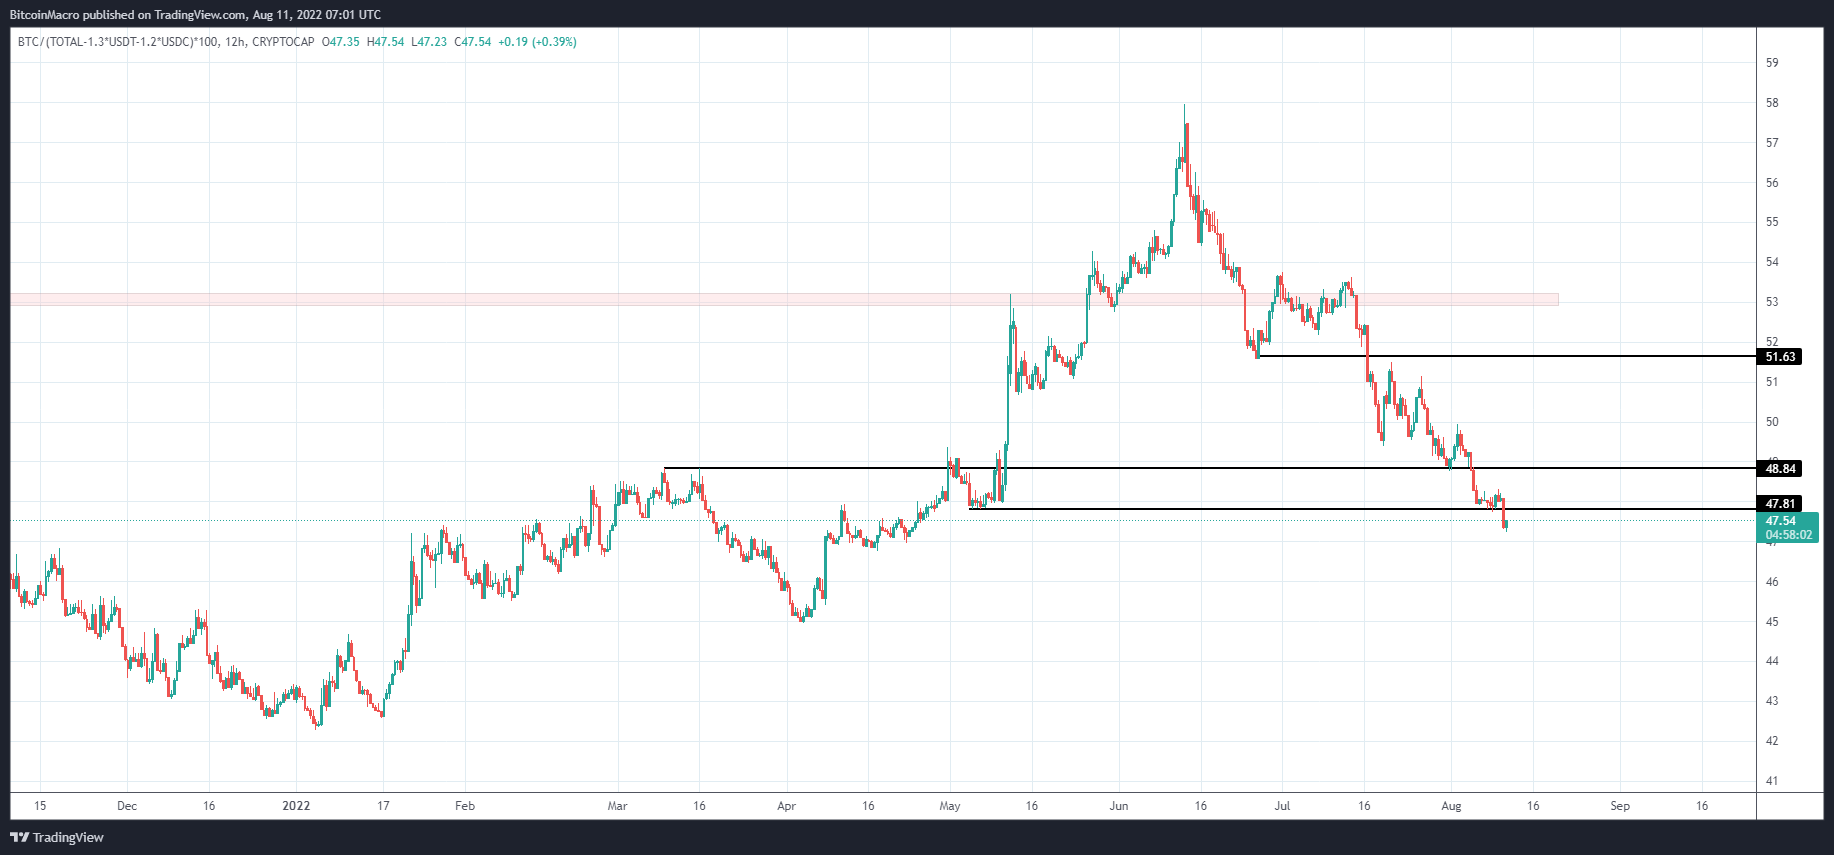
Cryptocurrency trader @BitcoinMacro21 stated that despite the ongoing decrease, BTCD could soon initiate a strong rally.
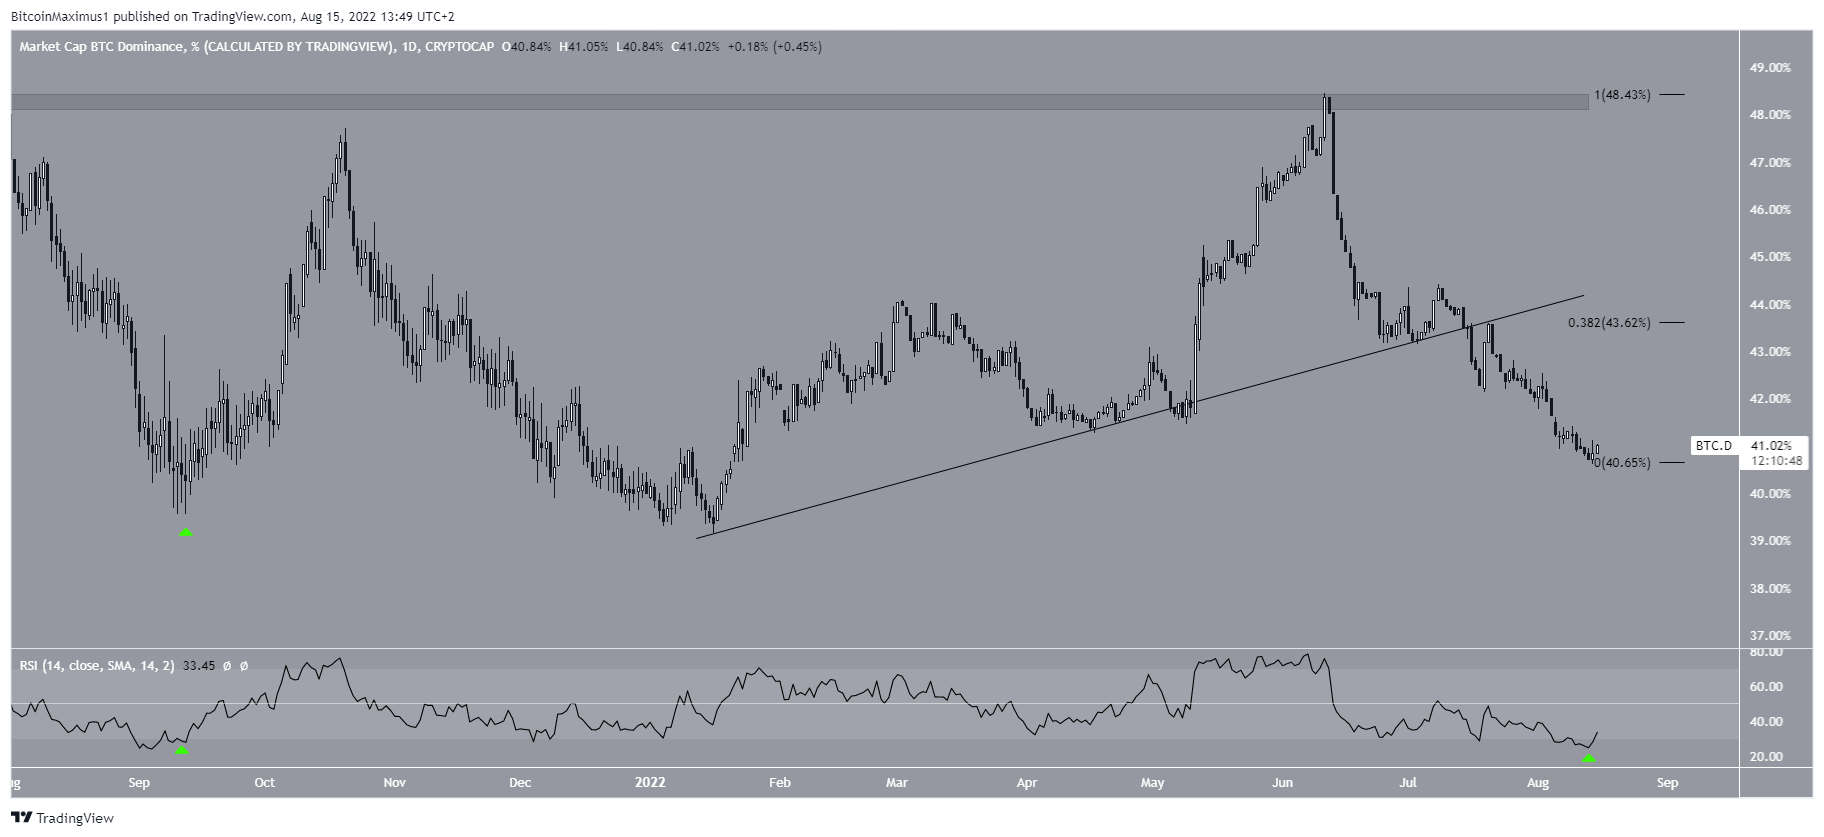
The daily chart shows that BTCD has also broken down from an ascending support line, which had previously been in place since the beginning of the year.
However, the daily RSI has fallen into oversold territory. The previous time it was at this level (green icon), a significant upward movement followed.
If one occurs, the closest resistance area would be at 43.50%, created by the previous ascending support line and the 0.382 Fib retracement resistance level.
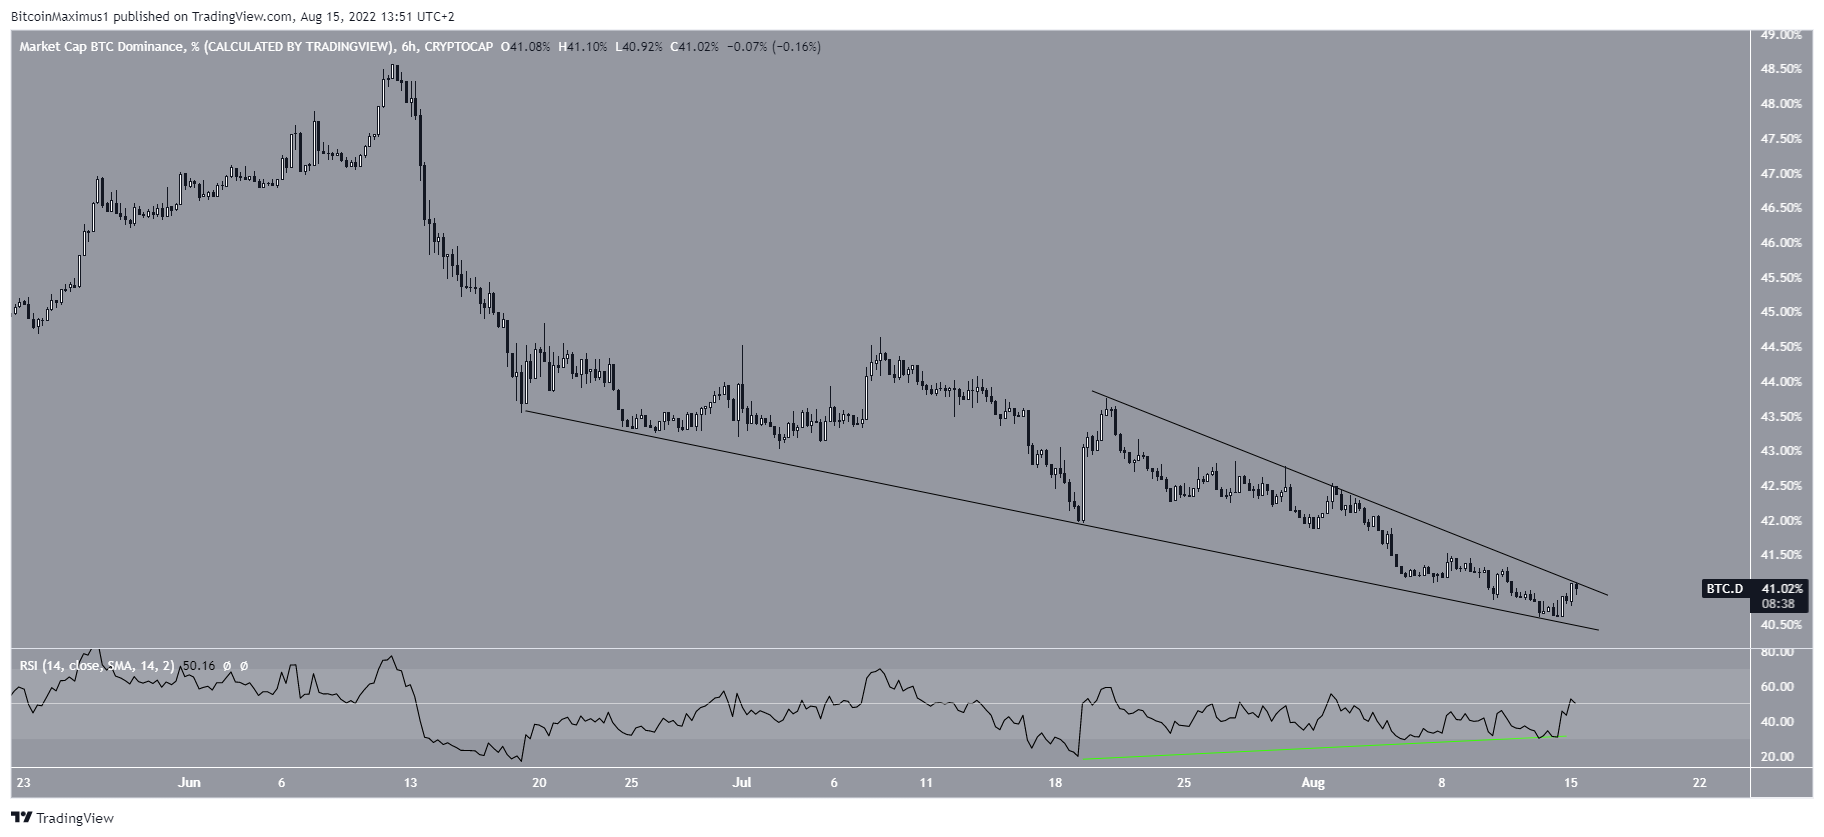
The possibility of a bounce is also supported by the six-hour chart, which shows that BTCD is trading inside a descending wedge, and has generated bullish divergence in the RSI. A breakout from the wedge would confirm that the short-term upward movement has begun.
ETH/BTC
Since Ethereum (ETH) is the largest altcoin by market cap, its movement is a big factor in changes in BTCD.
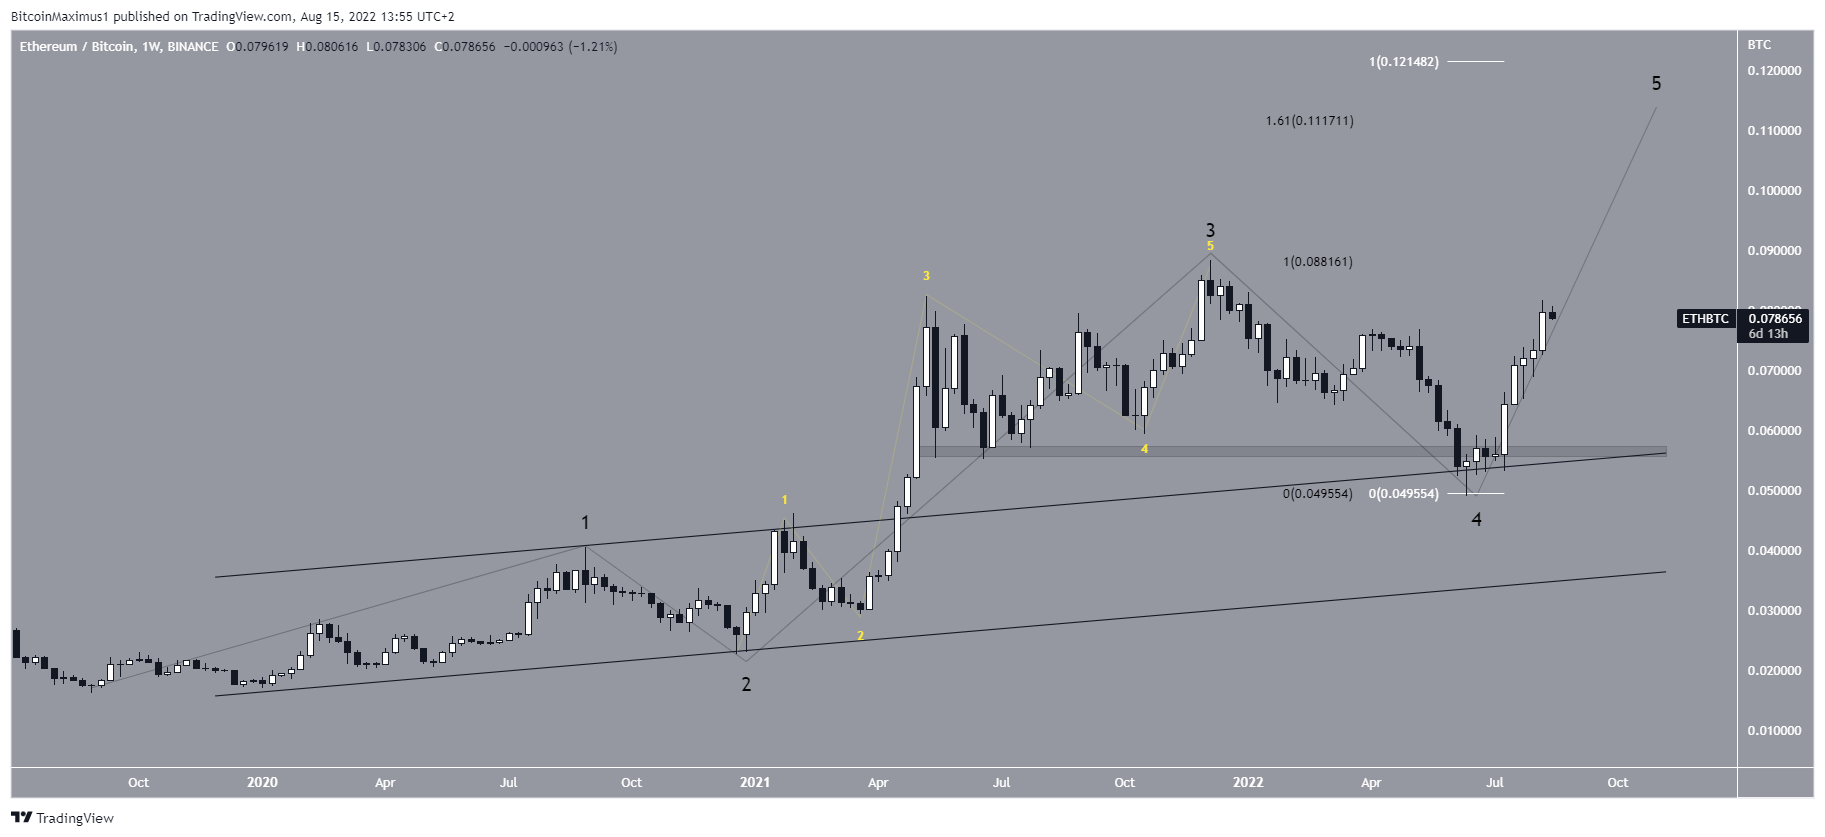
ETH seems to have begun a five-wave upward movement in Sept 2019 (black). If so, it is currently in the fifth and final wave.
A potential target for the top of this movement is between ₿0.117 and ₿0.121. The target is found by using a 1.61 external retracement on wave four (black) and the length of waves one and three (white).
For Be[in]Crypto’s latest Bitcoin (BTC) analysis, click here