
The bitcoin dominance rate (BTCD) has fallen to the lowest value since early 2018, while Ethereum (ETH) has been increasing at an accelerated rate preceding the merge.
With the Ethereum merge scheduled for Sept. 15, there is considerable hype (though not all of it positive) around the ecosystem and its new proof-of-stake protocol. This has caused ETH prices to increase considerably. ETH is currently 60% higher than its June lows.
The altcoin hype does not end with the Merge. Cardano (ADA), the sixth biggest altcoin when measured by its market cap, will undergo its Vasil hard fork upgrade on Sept. 22. This is the biggest upgrade to date and will bring increased network capacity and lower cost transactions.
Bitcoin dominance (BTCD)
Bitcoin dominance had been trending above the 40.50% horizontal support area since reaching a bottom in May 2021. After three bounces, it failed to make any significant breakthroughs and reached a local high of 48.45% in June 2022.
BTCD has been falling since and reached a local low of 39.07% on Sept. 6, breaking down from the support area in the process. Moreover, the weekly RSI has broken down from an ascending support line (green) which had been in place since May 2021. Both of these are considered decisive signs of a bearish trend.
If the downward movement continues, the 1.61 external Fib retracement when measuring the most recent bounce is found at 34.10%. A fall back to this level would mark a new all-time low for BTCD.

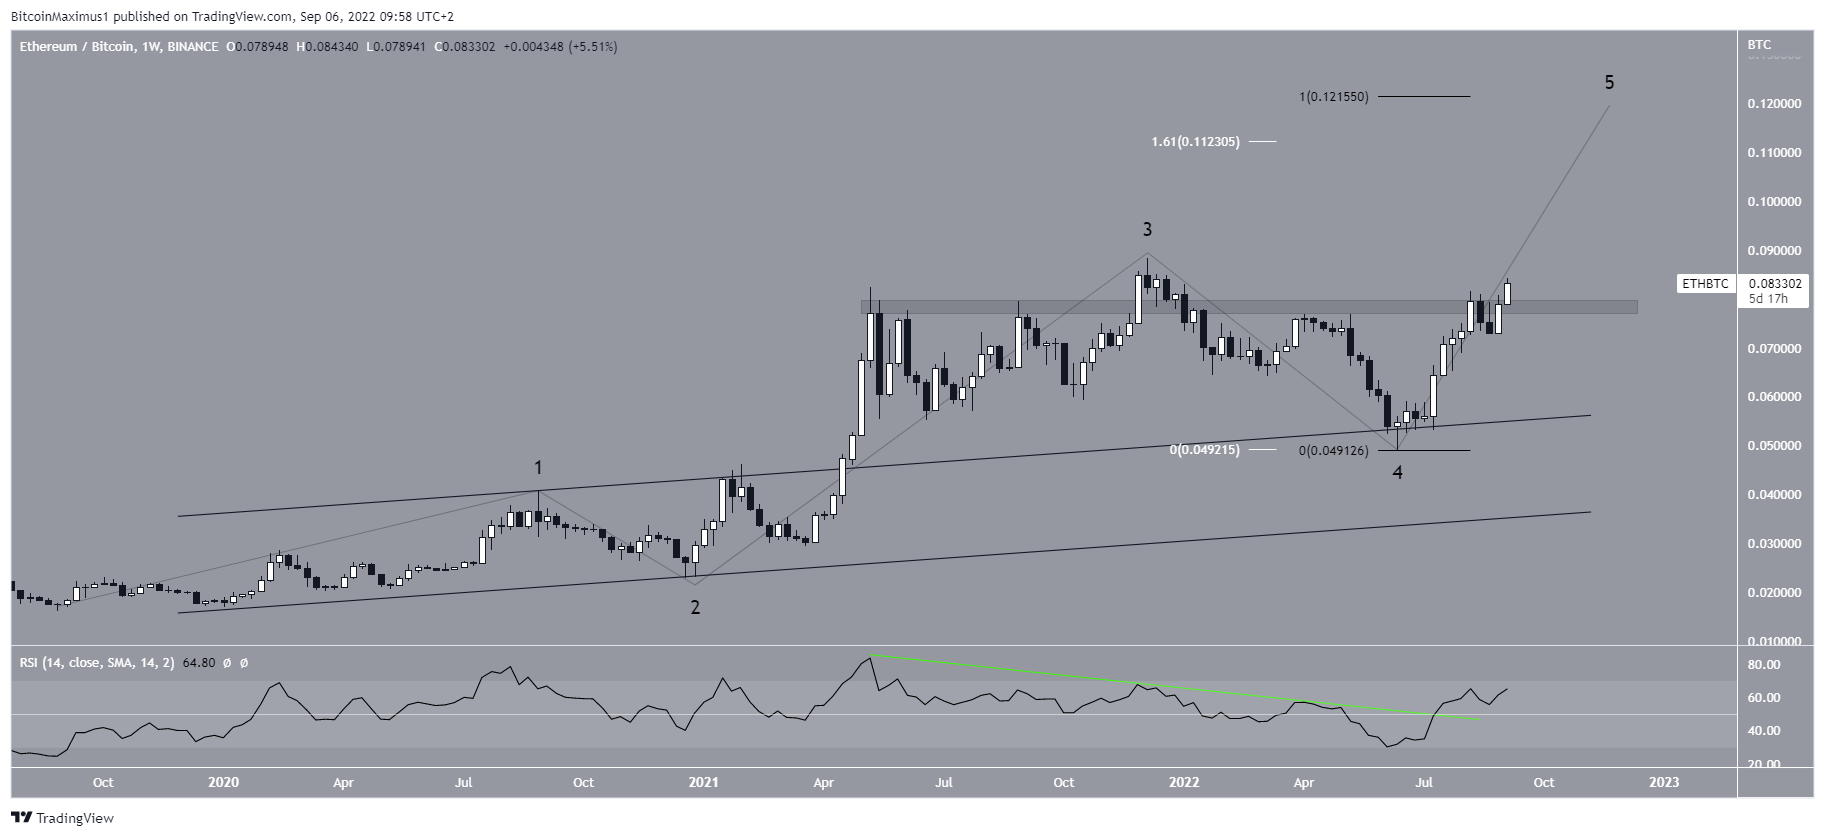
ETH/BTC
ETH/BTC has been moving upwards since reaching a low of ₿0.049 in June 2022. So far, the pair has reached a high of ₿0.084on Sept. 6. This is nearly the highest value for the pair since early 2018, with the only higher high being ₿0.088 reached in December 2021.
The upward movement looks extremely bullish, since the pair has broken out from the ₿0.079 resistance area, and the weekly RSI has moved above 50 (green line). Both of these are considered signs of bullish trends.
If the increase continues, the main resistance area would be found between ₿0.11 and ₿0.12. This target range is the 1.61 external retracement level of the drop (white) and the length of waves one and three (black).
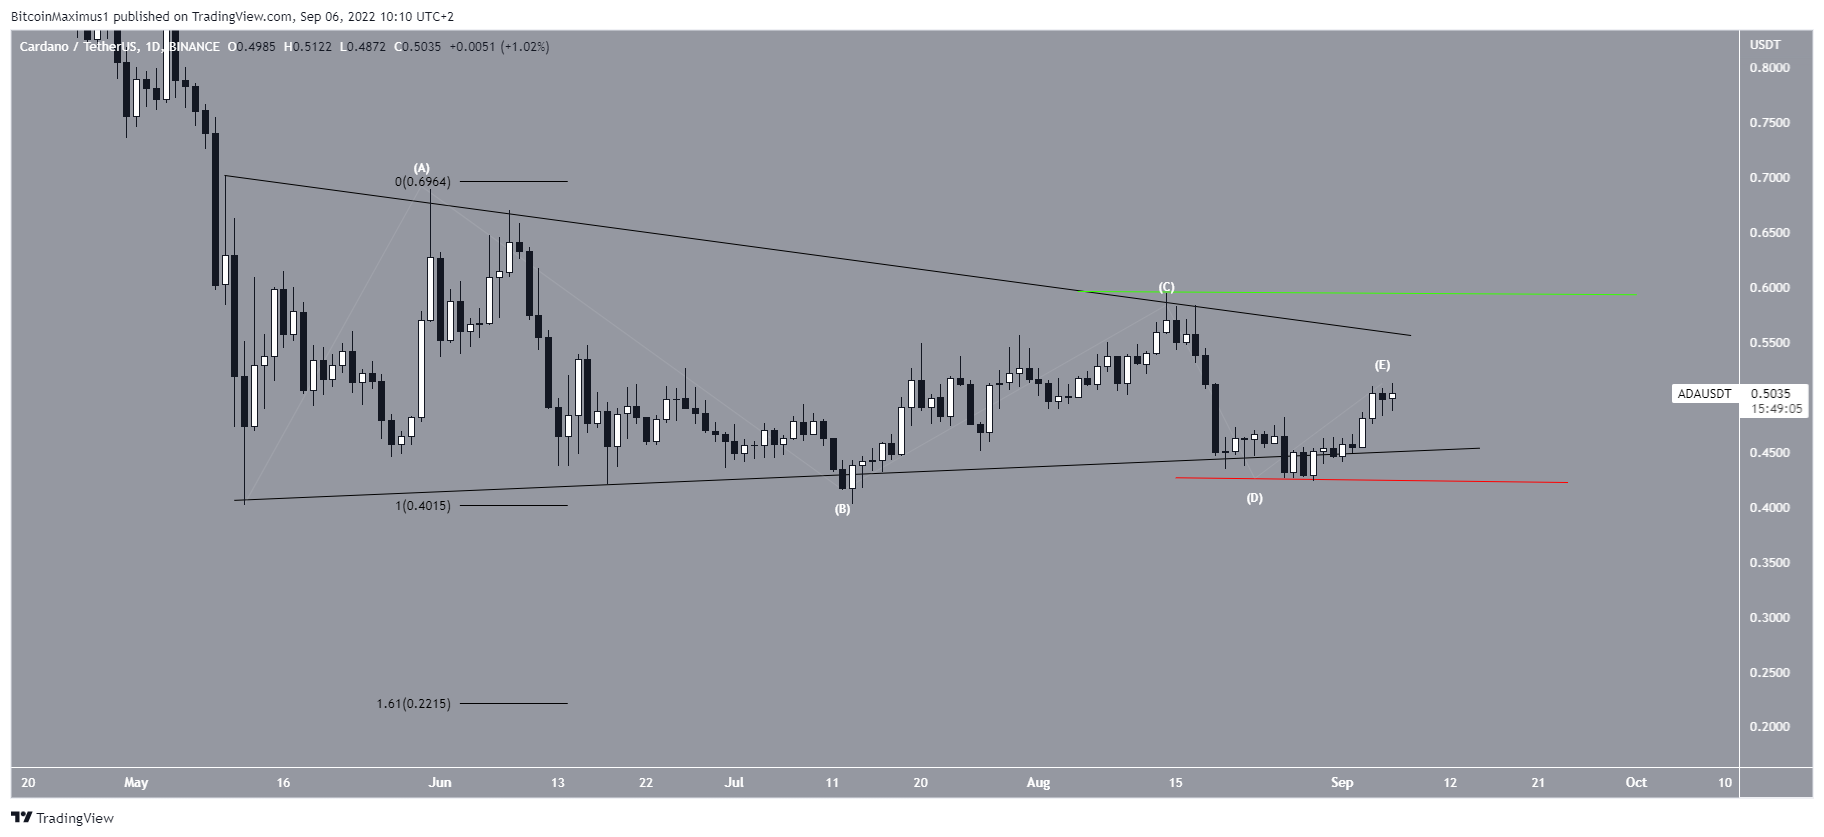
ADA
Unlike ETH, ADA has not increased much relative to its June lows. On the contrary, it has been consolidating inside a symmetrical triangle. Currently, it is approaching the end of the triangle, at which point a decisive move is likely to occur. The symmetrical triangle is normally considered a neutral pattern, meaning that both a breakdown or a breakout are equally possible.
Whether ADA breaks out above the $0.594 high (green line) or gets rejected at the $0.423 low (red line) will likely determine the direction of the future trend.
If ADA breaks down, the next closest support area would be found at $0.22. This target is the 1.61 external Fib retracement level when measuring the height of the triangle.
For Be[in]Crypto’s previous Bitcoin (BTC) analysis, click here