
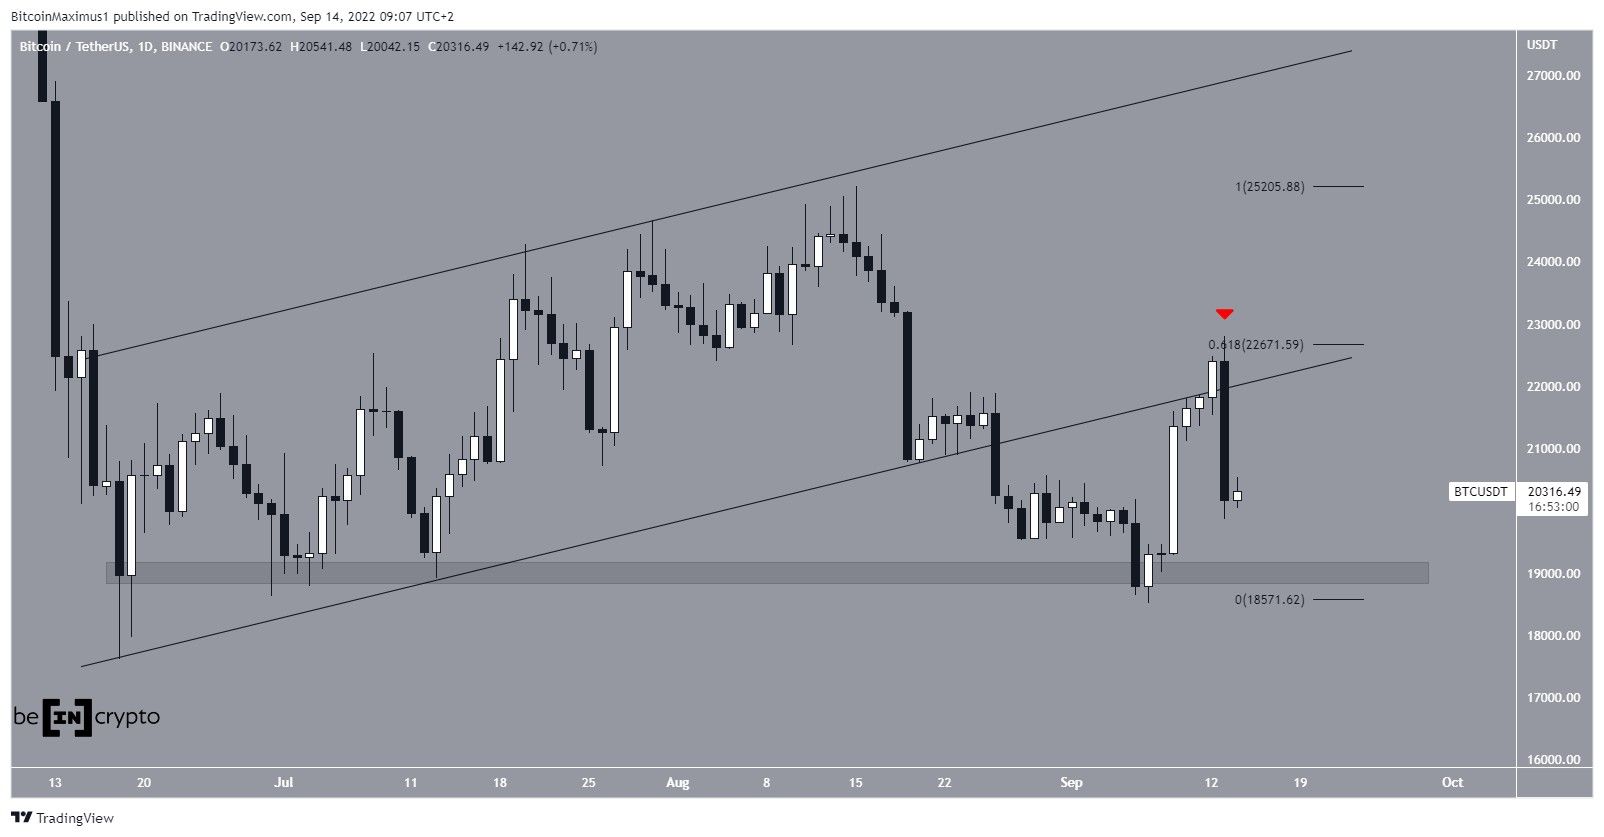
Bitcoin (BTC) decreased sharply on Sept. 13, casting some doubt in the legitimacy of the preceding upward movement.
BTC reached a high of $22,799, briefly moving above the 0.618 Fib retracement resistance level of the entire previous downward movement (red icon). The high also seemed to cause a reclaim of the support line of the previous ascending parallel channel.
However, the price failed to sustain its upward movement and decreased sharply the same day, creating a massive bearish engulfing candlestick that led to a low of $19,860. The rejection validated both the 0.618 Fib retracement resistance level and the previous support line as resistance.
If the downward movement continues, the closest support area would be at $19,000.
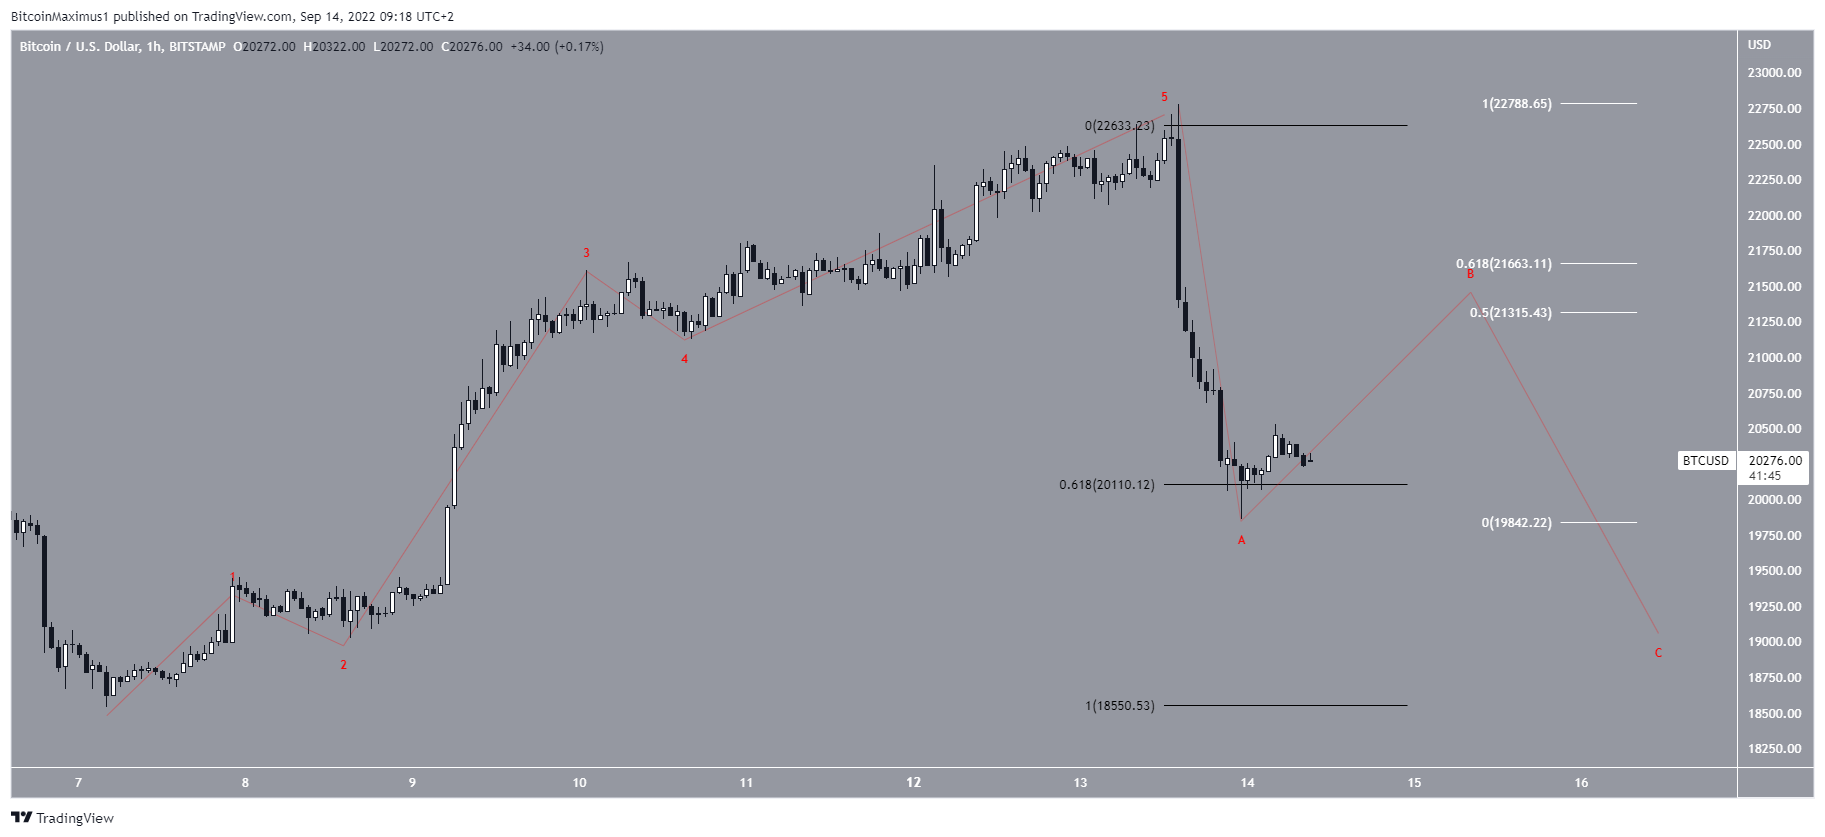
Wave count analysis
The increase since Sept. 7 clearly looks like a five-wave upward movement. So, it would make sense that the ensuing decrease is part of an A-B-C corrective structure. However, the fact that the decrease was extremely sharp, immediately reaching the 0.618 Fib retracement support level (black) cast some doubt in this possibility.
Since there are also several potential long-term wave counts still in place, it is safe to say that the wave count is still unclear.
Nevertheless, the most likely movement would suggest that an increase towards the 0.5-0.618 Fib retracement resistance levels (white) is expected prior to another drop. The aforementioned resistance is at $21,300 to $21,660.
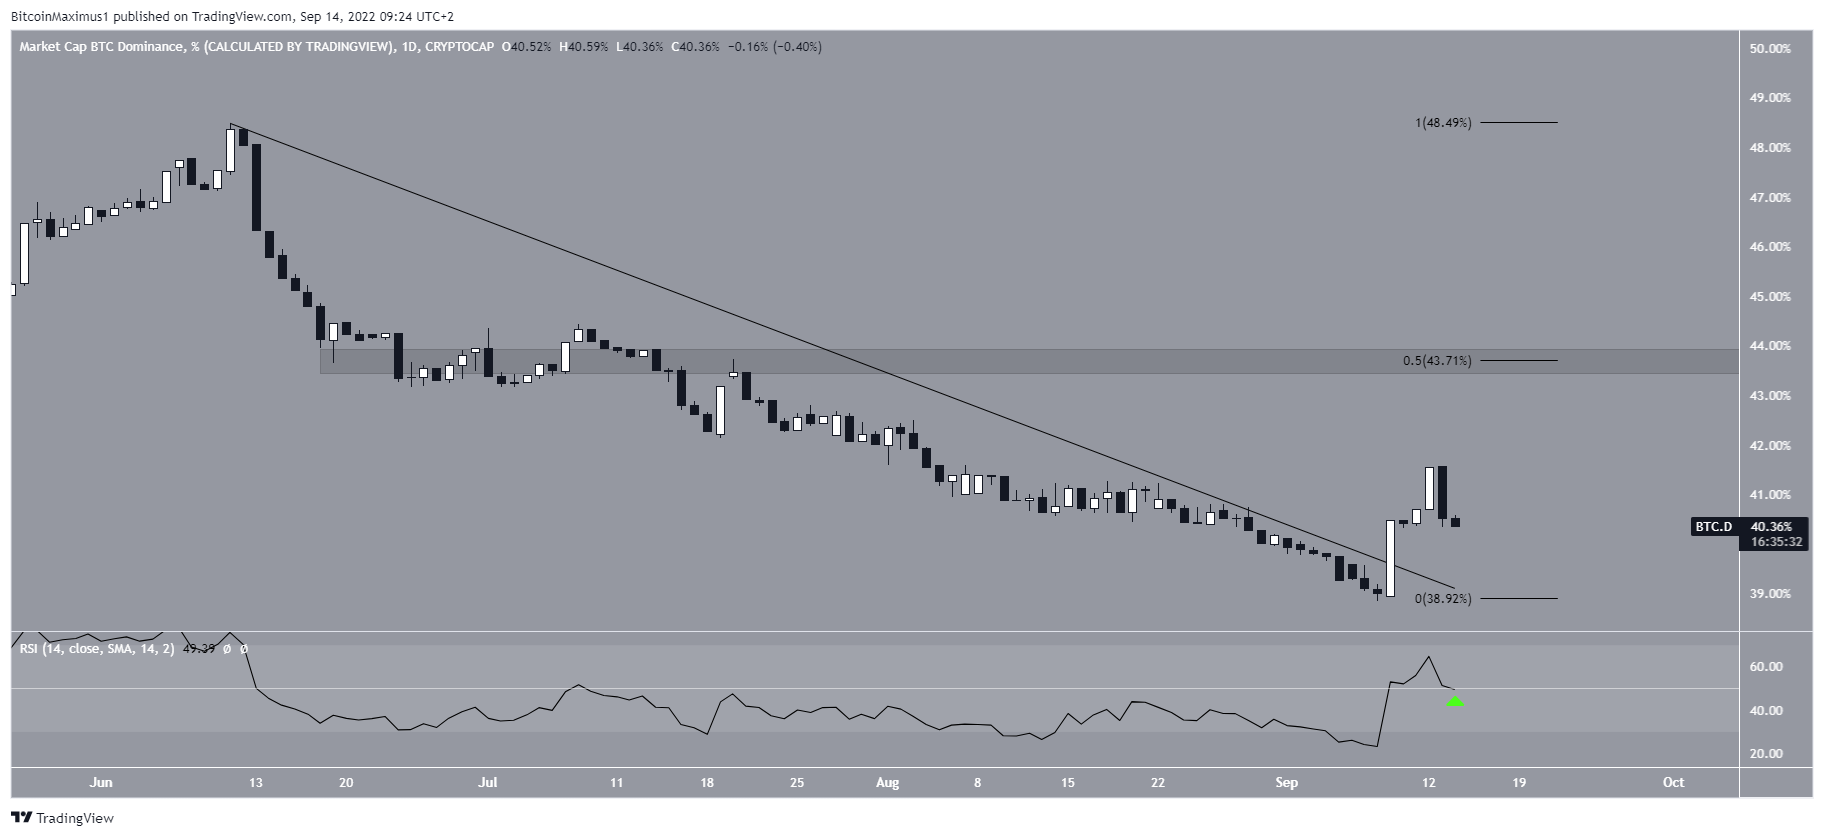
BTC dominance rate
An interesting development during yesterday’s decrease is that the Bitcoin Dominance Rate (BTCD) decreased sharply during the BTC price decrease. However, despite this decrease, BTCD seems to have broken out from a descending resistance line and the daily RSI has moved above 50 (green icon).
Both of these are considered signs of bullish trends. So, they support an upward movement towards the 0.5 Fib retracement resistance level at 43.70%.
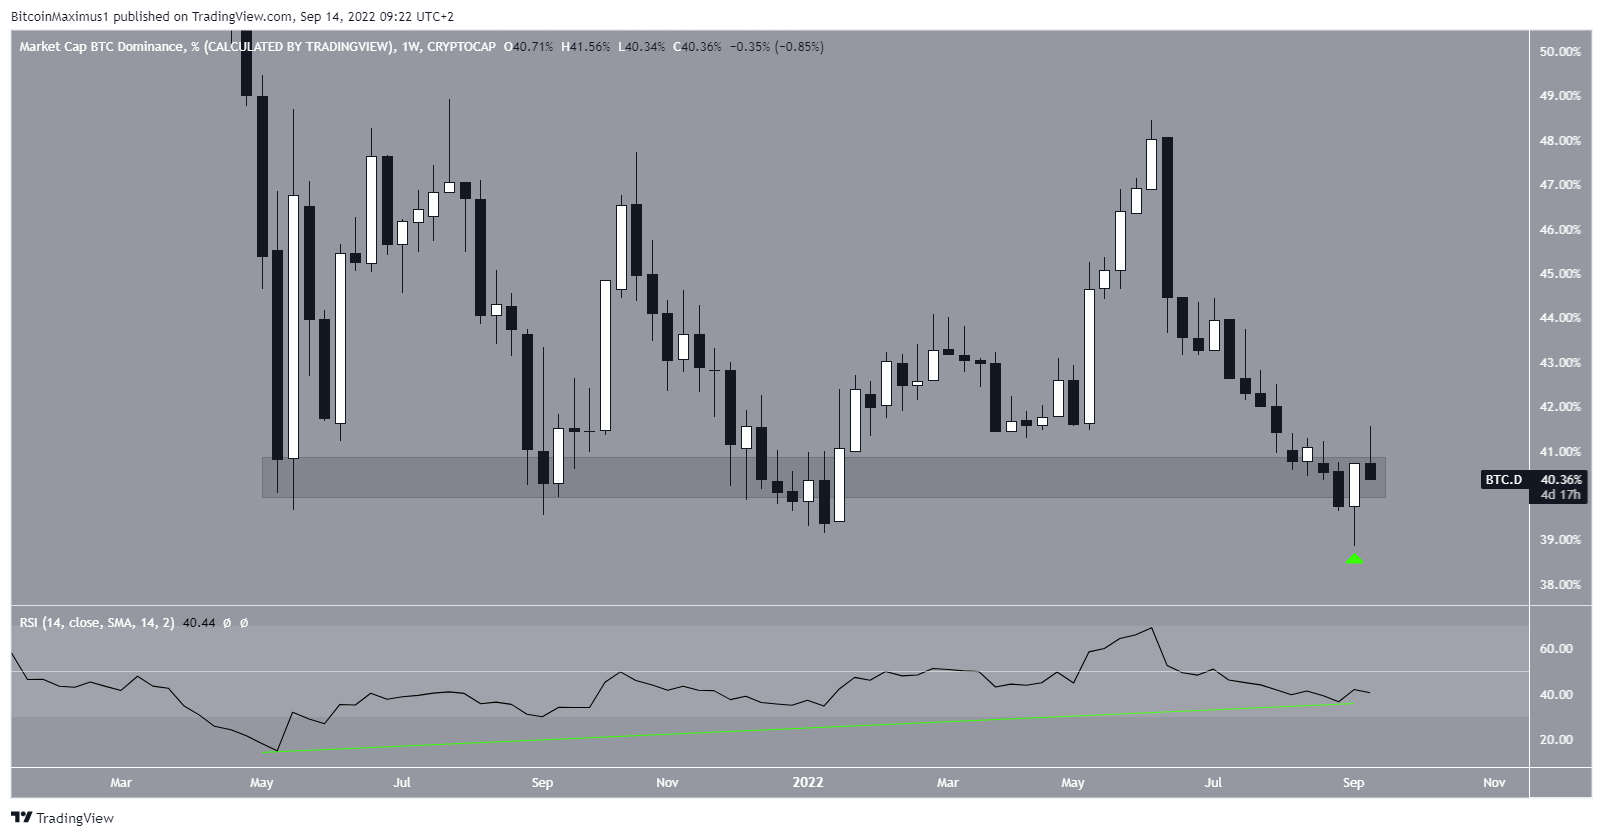
The weekly chart supports this possibility, since it shows that BTCD is trading inside long-term support at 40.50% and has created a bullish candlestick in the weekly time frame. Moreover, the weekly RSI has generated a significant bullish divergence, aligning with the readings from the daily timeframe.
For Be[in]Crypto’s previous Bitcoin (BTC) analysis, click here