
Bitcoin (BTC) has created a bearish weekly candlestick and is showing several bearish signals in the daily time frame.
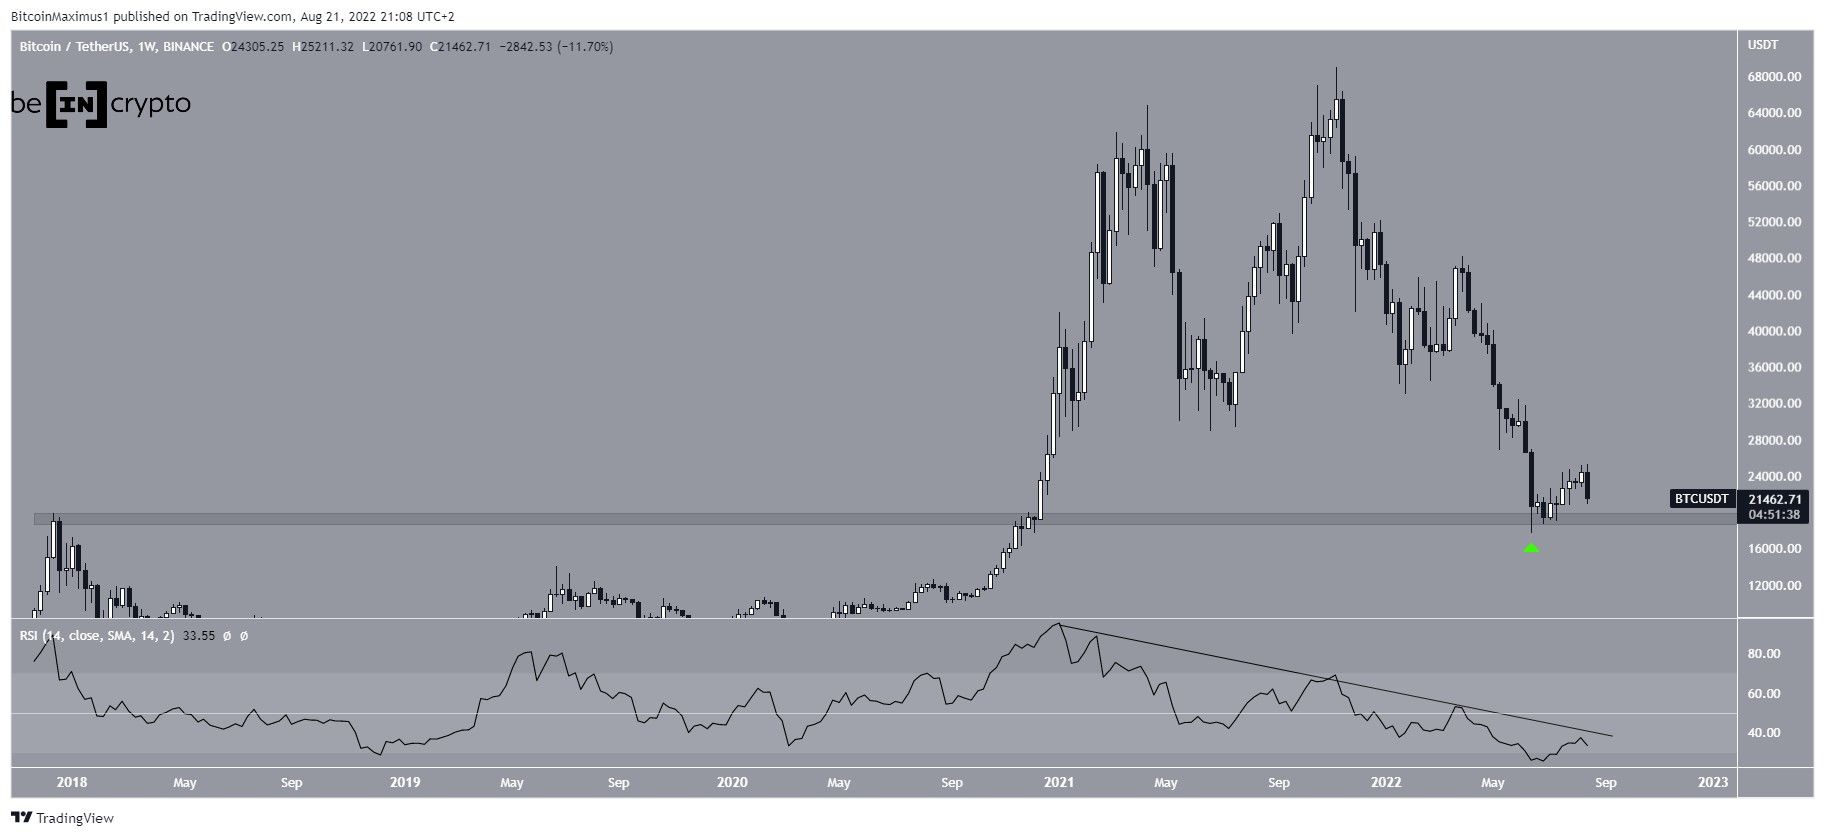
Bitcoin has been falling since reaching an all-time high price of $69,000 in November 2021. The downward move has so far led to a local low of $17,622 that was made in June 2022.
The price rebounded after (green icon), validating the $19,300 horizontal area as support and has been increasing since.
While this upward movement led to a local high of $25,211 on Aug. 15, Bitcoin created a bearish engulfing candlestick during the week of Aug. 15-22. In turn, this invalidated a large portion of the gains made since the June bottom.
Additionally, the weekly RSI is still following a descending resistance line and has yet to move above 50. So, the weekly trend is still considered bearish.
Current BTC pattern
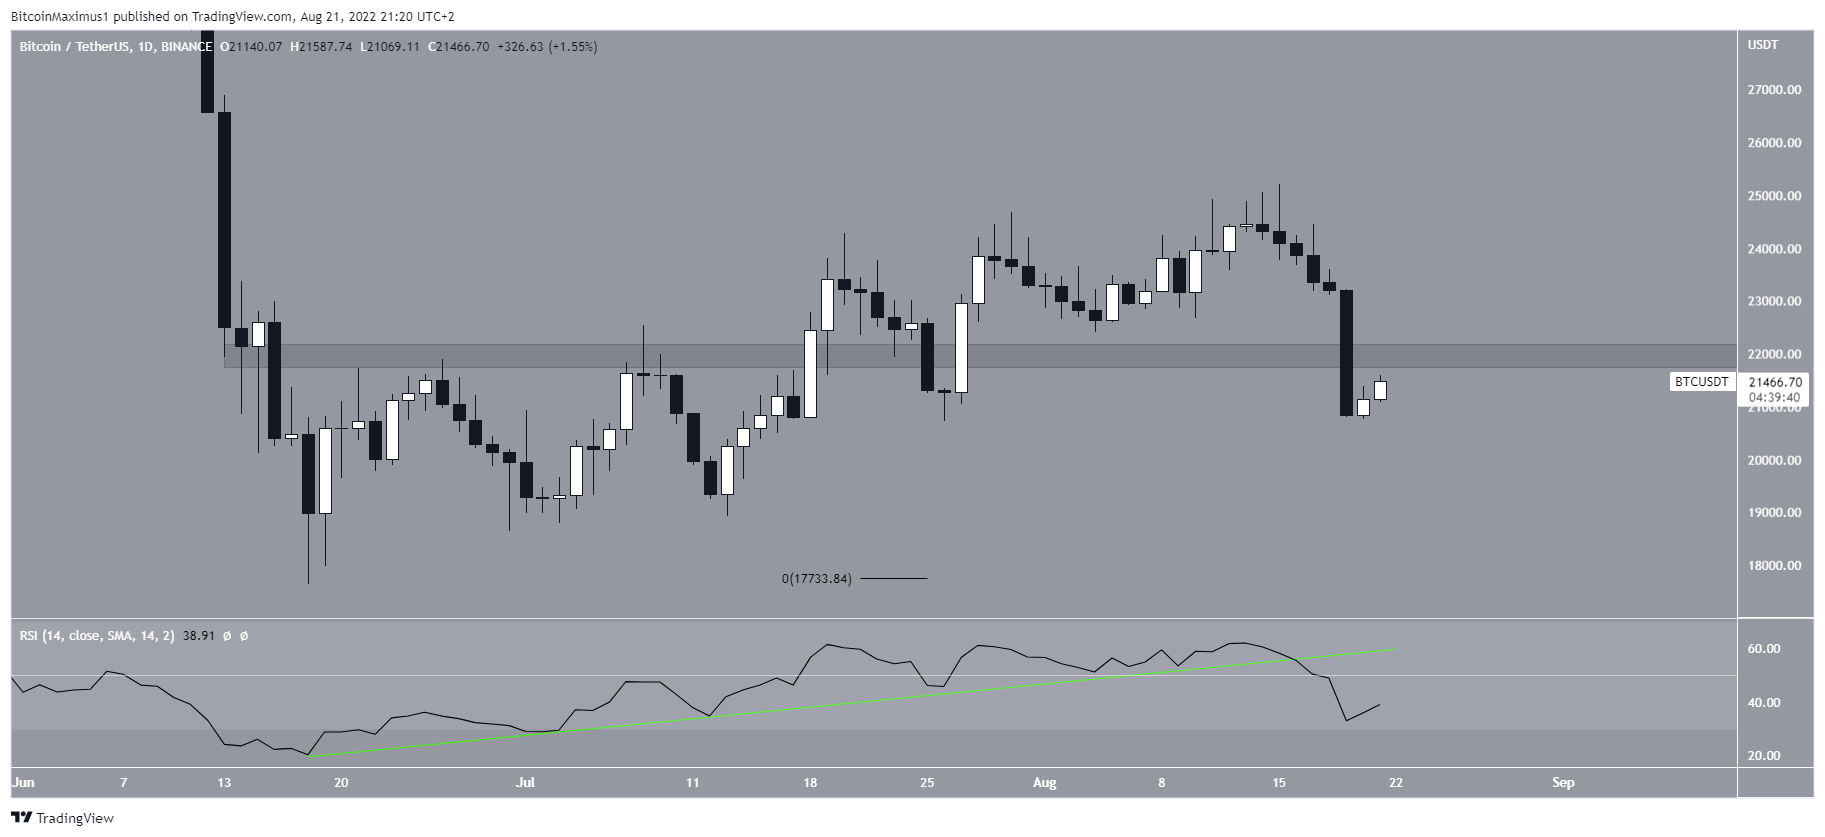
The daily chart provides a mostly bearish outlook. The main reason for this is that the daily RSI has broken down from its ascending support line and also fallen below 50. Such movements usually precede price decreases. Moreover, the RSI decrease below 50 is considered a sign of a bearish trend.
Furthermore, the price has fallen below the $22,000 area after seemingly breaking out above it. The area is now expected to provide resistance.
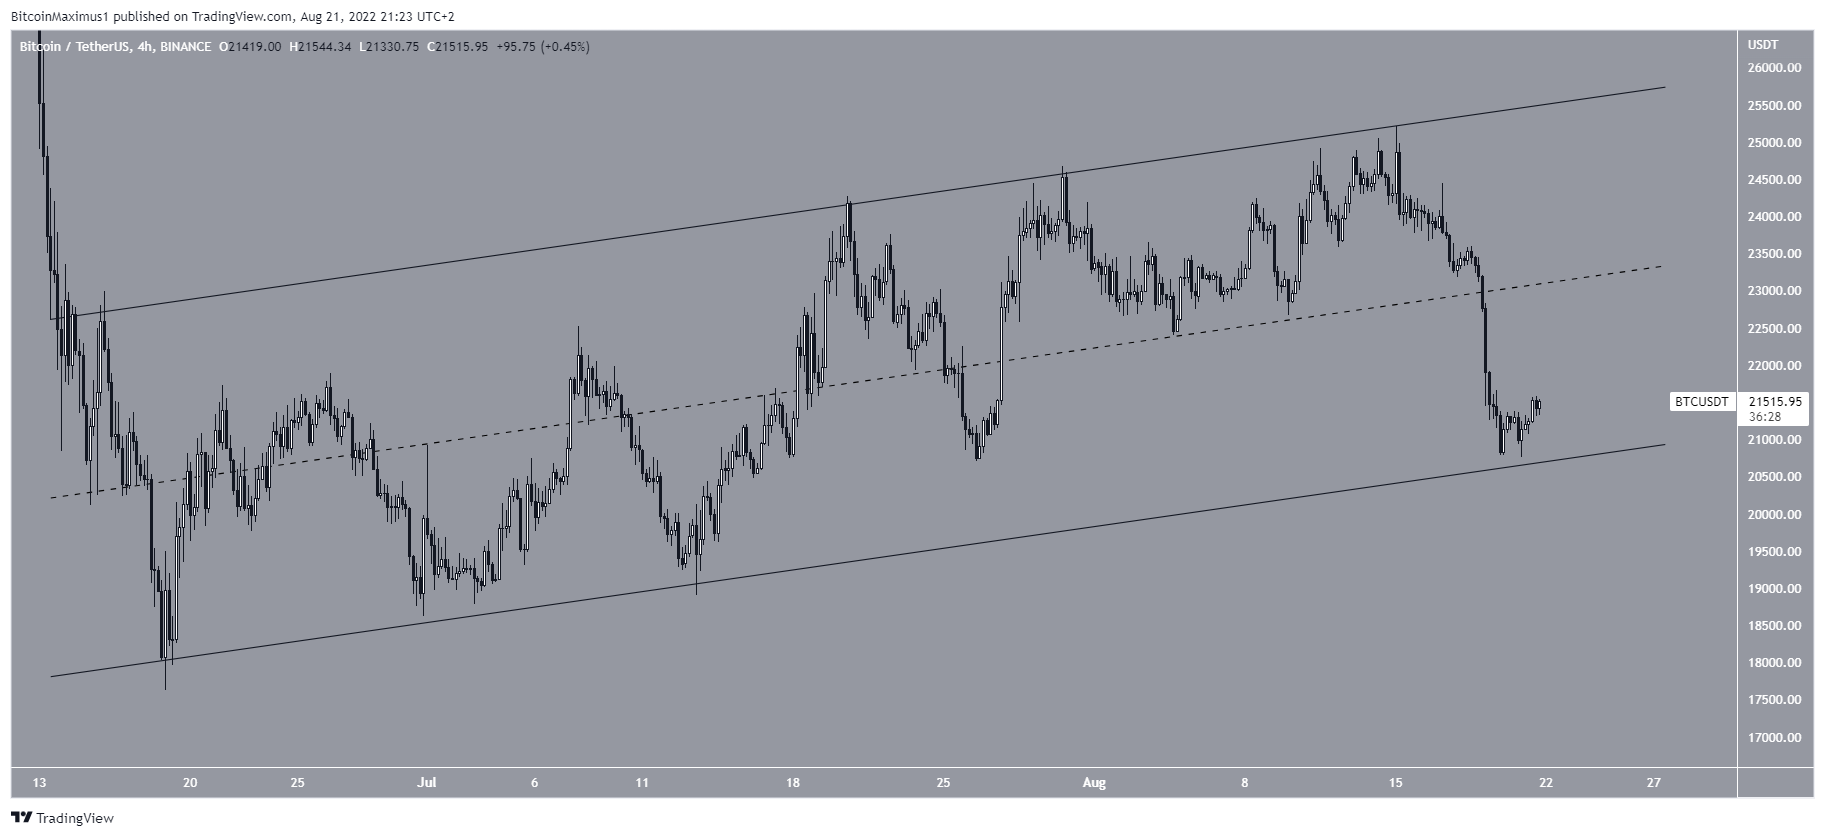
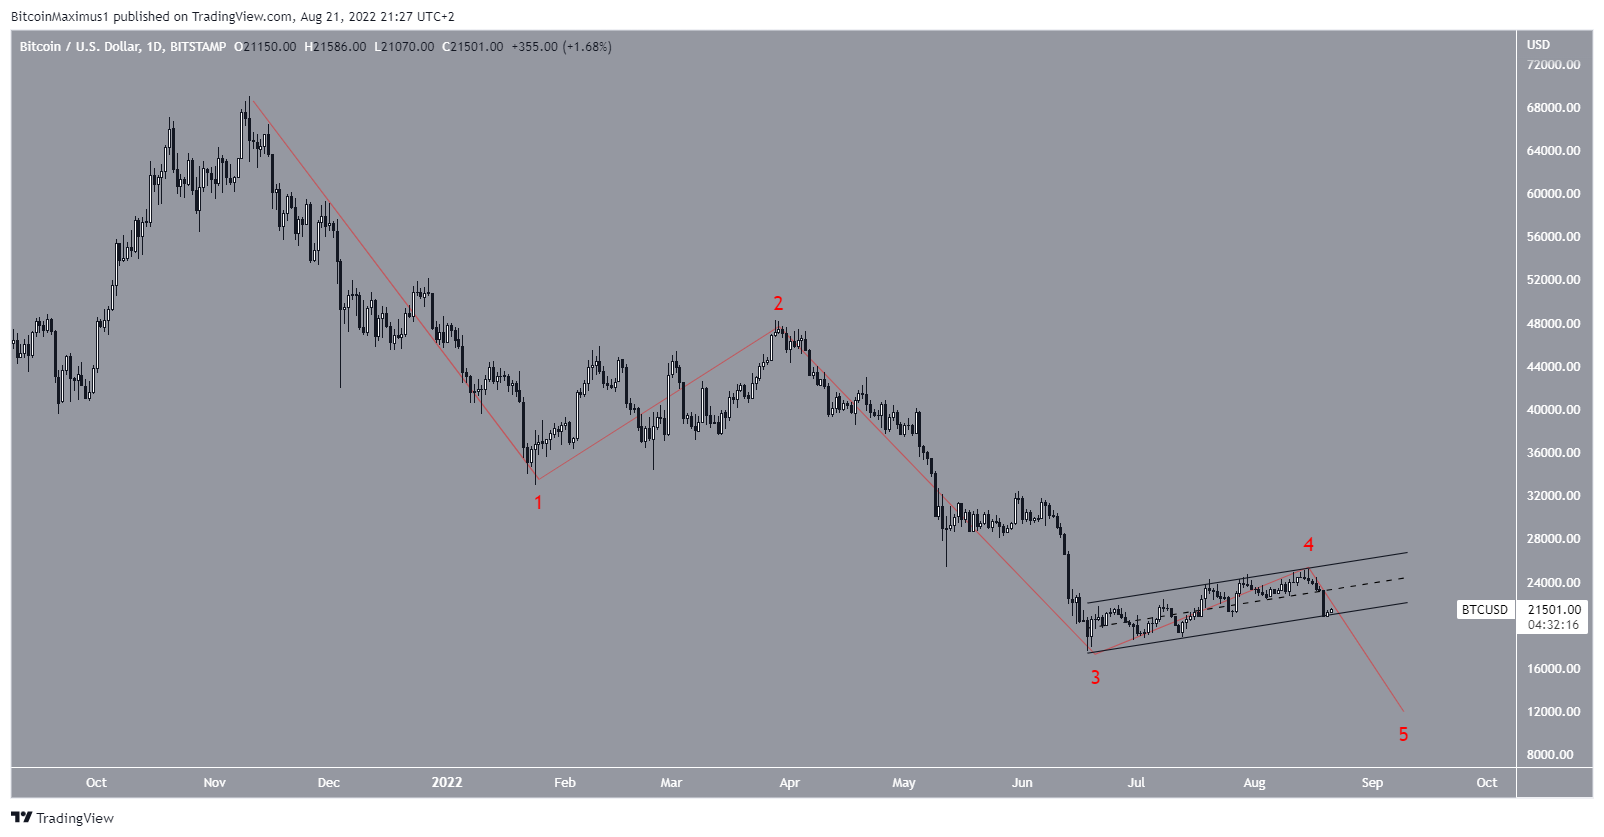
The six-hour chart shows that BTC has been trading inside an ascending parallel channel since its June 18 bottom. Such channels usually contain corrective structures, meaning that an eventual breakdown from it would be the most likely scenario.
Also, Bitcoin is currently in the lower portion of the channel, granting legitimacy to the possibility that the price will break down from the channel.
If this occurs, BTC will likely fall towards new lows.
Wave count analysis
The most likely long-term wave count suggests that measuring from the all-time high, Bitcoin has completed an A-B-C corrective structure (red). In it, waves A and C had a 1:1.61 ratio, which is the most common in such structures.
The possibility that a bottom has been reached fits with various on-chain indicators.
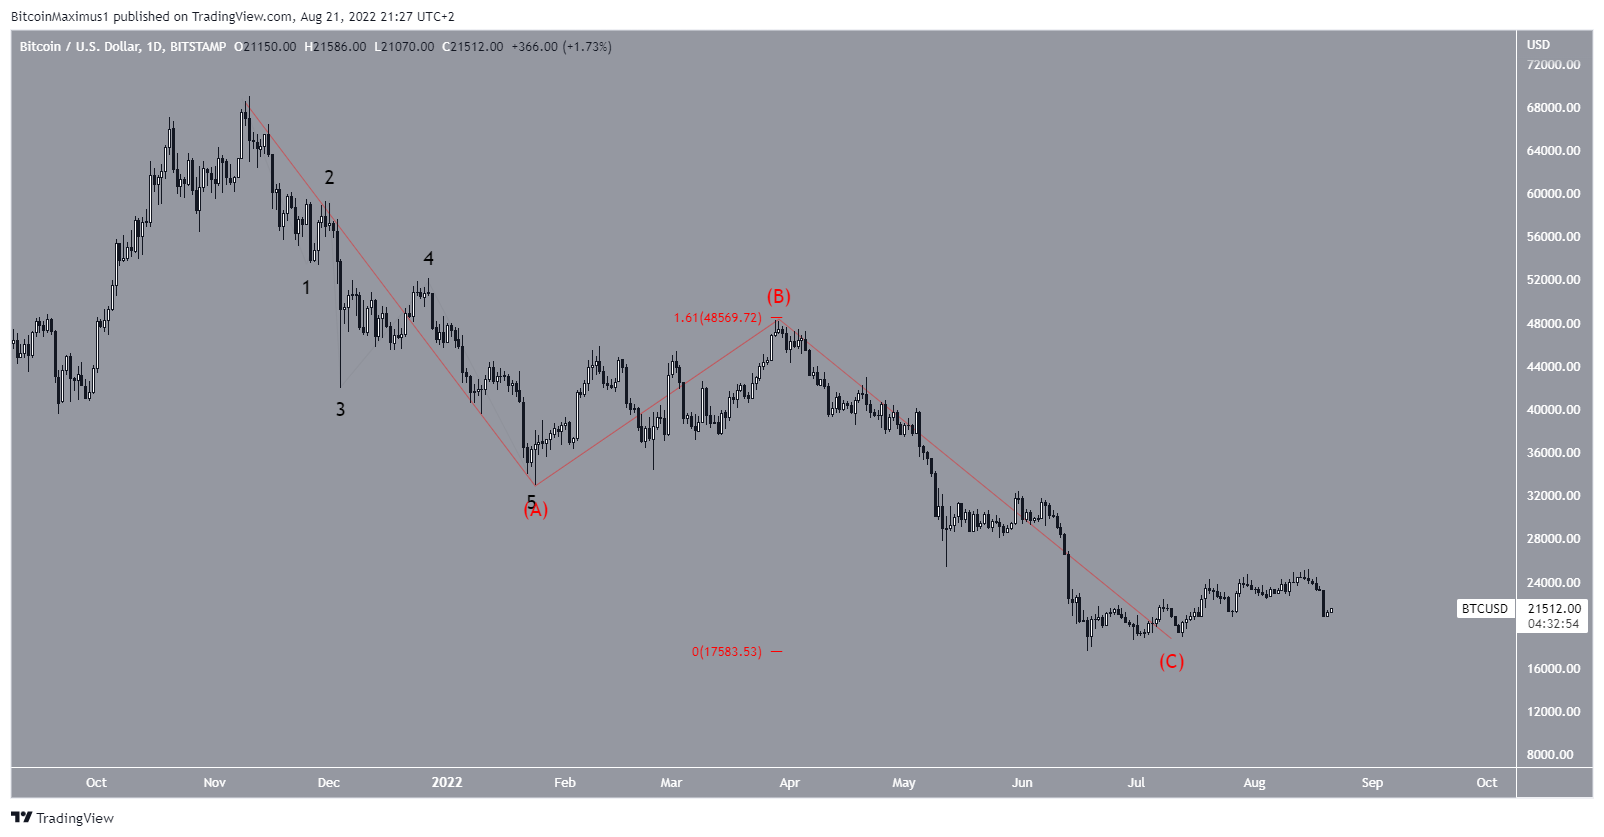
Due to the presence of the channel, the alternative count would suggest that Bitcoin has just completed wave four and another final decrease will follow prior to the bottom.
Until Bitcoin breaks down from the channel, this remains the alternative count.
For Be[in]Crypto’s previous Bitcoin (BTC) analysis, click here