
Bitcoin (BTC) reached a decisively bullish close during the week of Sep 5-12, supporting the possibility that it has begun a bullish reversal.
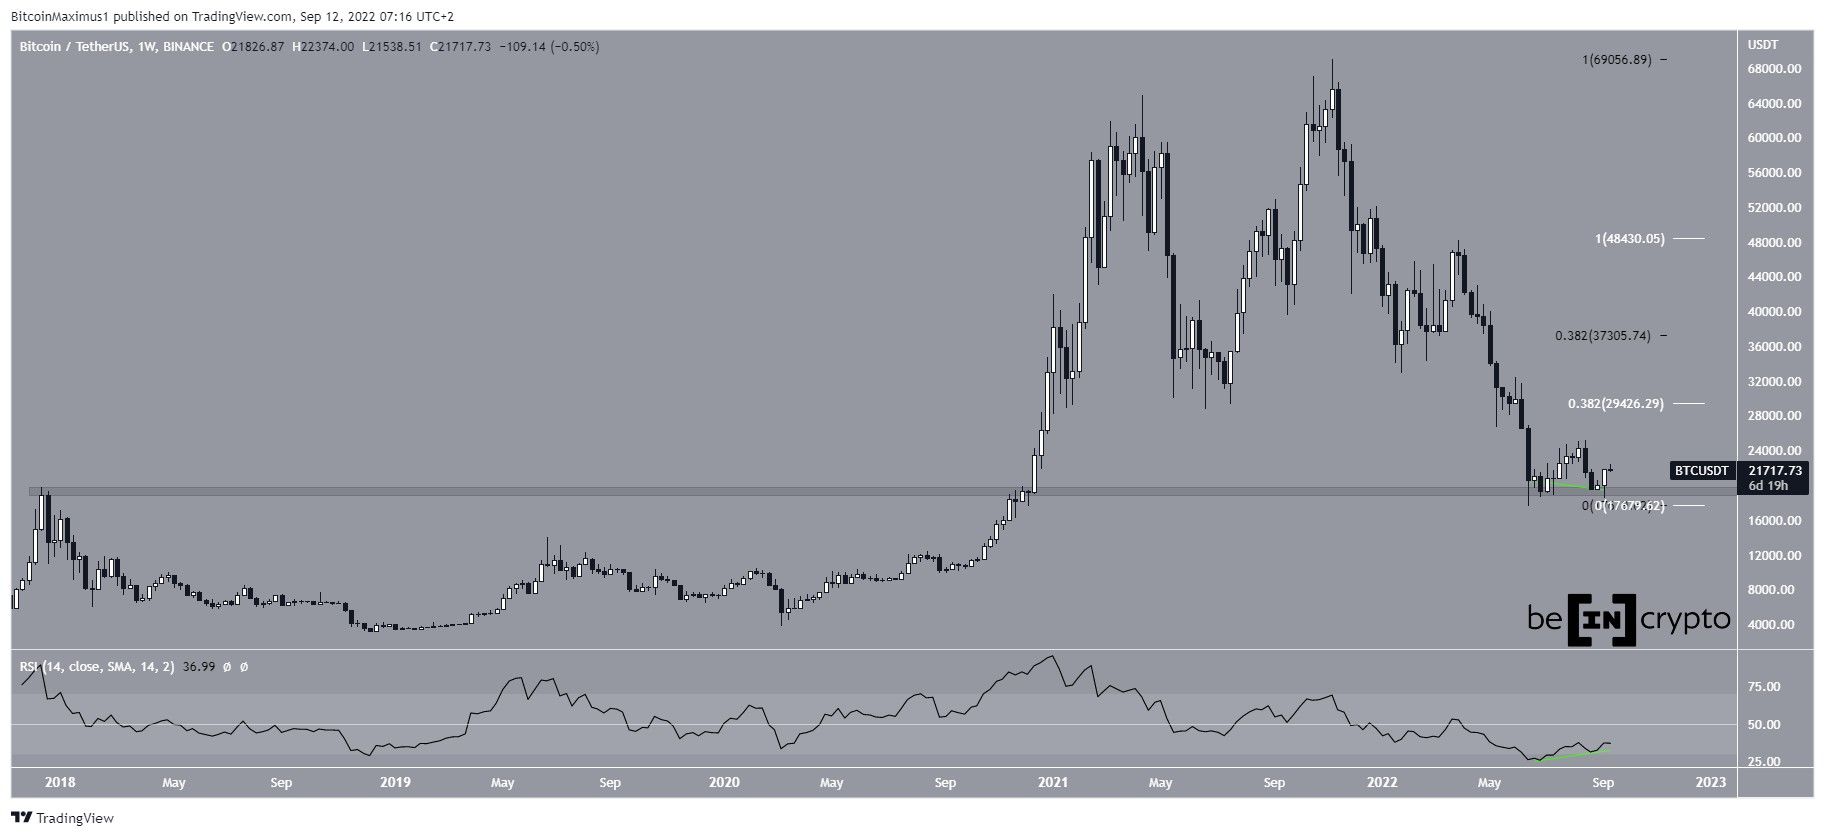
Since June, BTC has been trading just above the $19,400 horizontal support area. This is an important area since it previously acted as the all-time high resistance in Dec 2017.
Last week, Bitcoin bounced sharply and created a long lower wick, which is considered a sign of buying pressure. Moreover, the price reached a decisively bullish close of $21,826. The fact that the weekly high and close were extremely close to each other is considered a bullish sign, since sellers were not able to push the price down.
Finally, the weekly RSI has generated bullish divergence and moved outside its oversold territory and all-time low region.
If the upward movement continues, the closest resistance area would be at $29,425. This is the 0.382 Fib retracement resistance level of the most recent portion of the downward movement.
Afterward, the next resistance would be at $37,300. This is the 0.382 Fib retracement resistance level (black) of the entire downward movement since the all-time high.
Ongoing increase
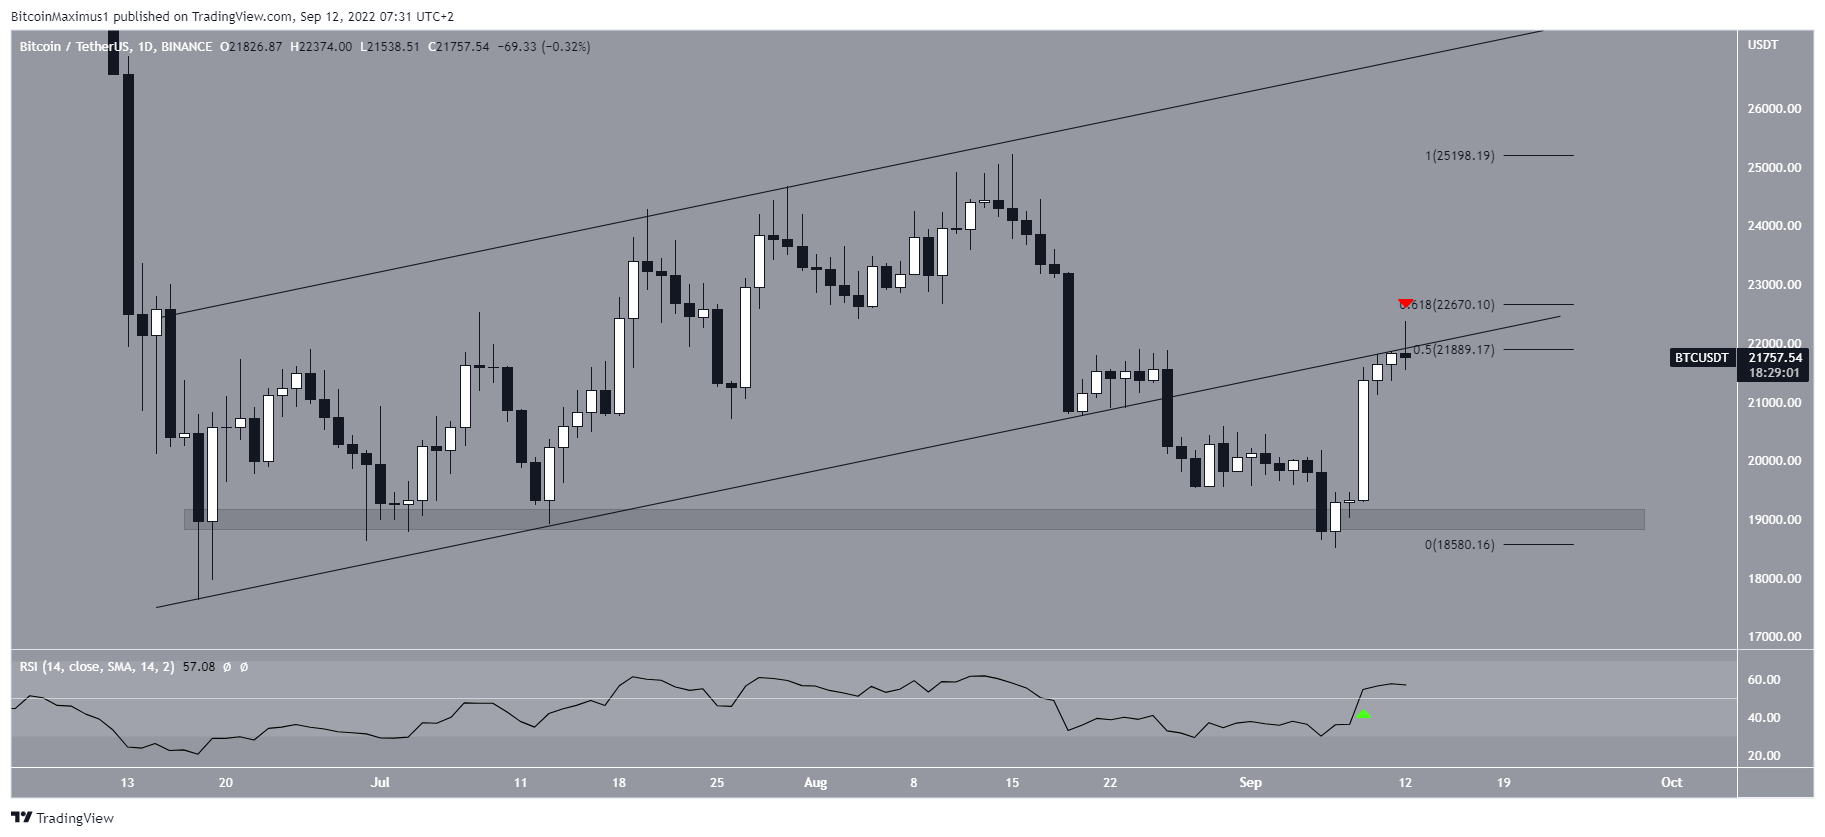
The daily chart shows that Bitcoin is in the process of creating a bearish candlestick (red icon). This is occurring at a confluence of resistance levels, created by the 0.5-0.618 Fib retracement resistance area between $21,900 and $22,600 and the support line of the previous ascending parallel channel.
But, the daily RSI is bullish, since it has just moved above the 50 line (green icon), which was previously providing resistance.
So, despite the bullish RSI, a reclaim of the channel and in turn the 0.5-0.618 Fib retracement resistance area is required for the trend to be considered as bullish.
BTC wave count analysis
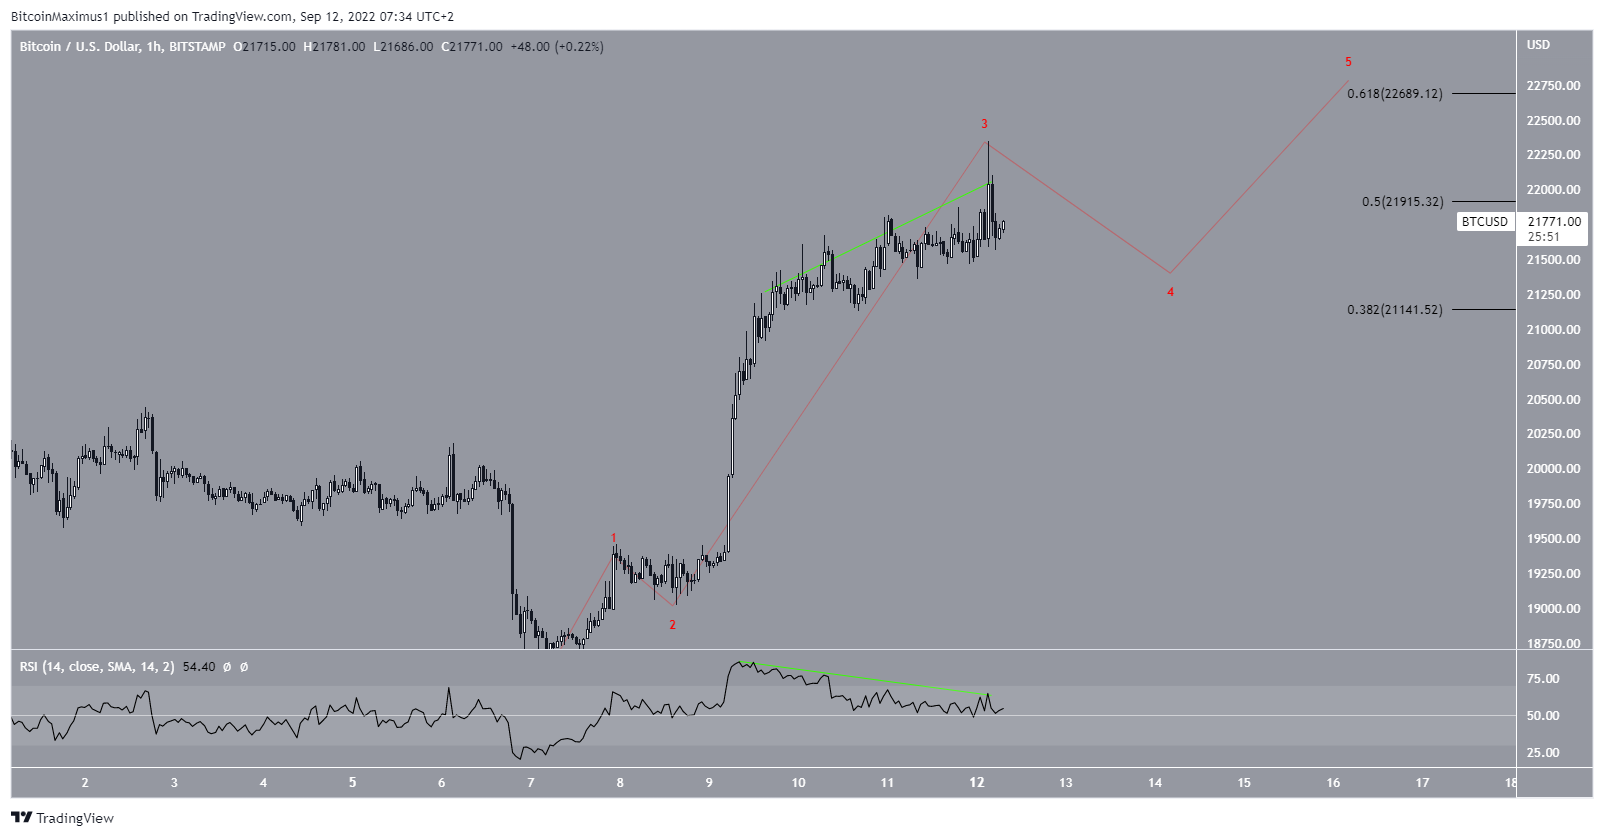
The wave count suggests that Bitcoin is in wave four of a five-wave upward movement (red) that began on Aug 7.
If correct, it would mean that after a brief correction, the price will increase once more towards the 0.618 Fib retracement resistance level at $22,700.
This possibility is also supported by the hourly RSI, which has generated bearish divergence (green line). Such divergences often precede slight decreases.
For Be[in]Crypto’s previous Bitcoin (BTC) analysis, click here