
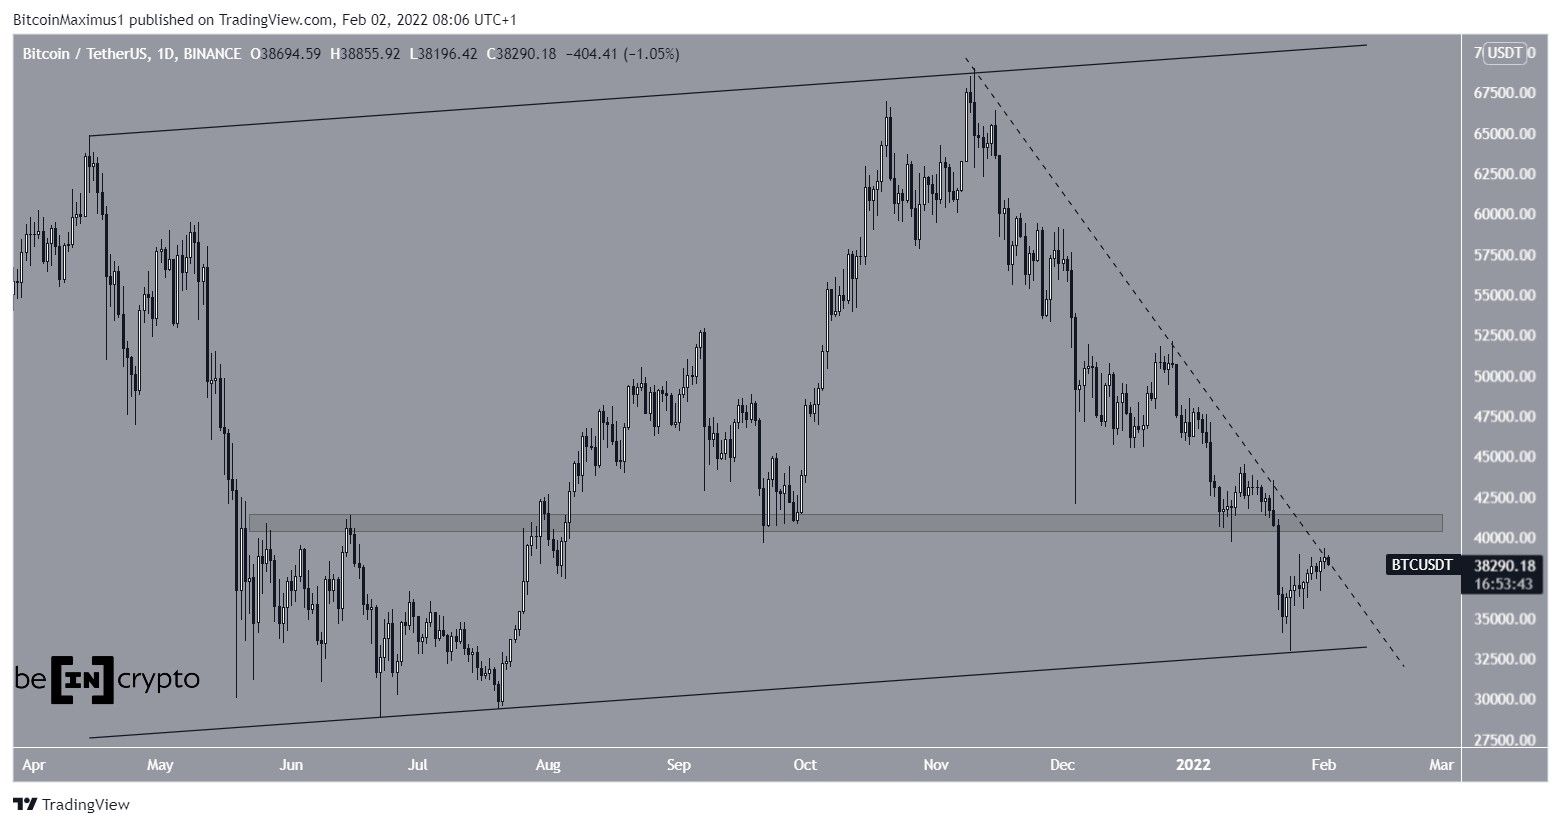
Bitcoin (BTC) has been moving upwards since Jan 24 and has now reached a long-term descending resistance line. An eventual breakout from this line is expected.
Bitcoin has been trading inside an ascending parallel channel since April 2021. On Jan 24, 2022, it reached a local low of $32,917 and bounced, creating a long lower wick that served to validate the channel as support.
Currently, BTC is trading slightly under a descending resistance line that has been in place since the $69,000 all-time high price of Nov 20, 2021. If it manages to break out, the closest resistance area would be found at $40,800. Therefore, there is considerable resistance just above the current BTC price.
Future movement
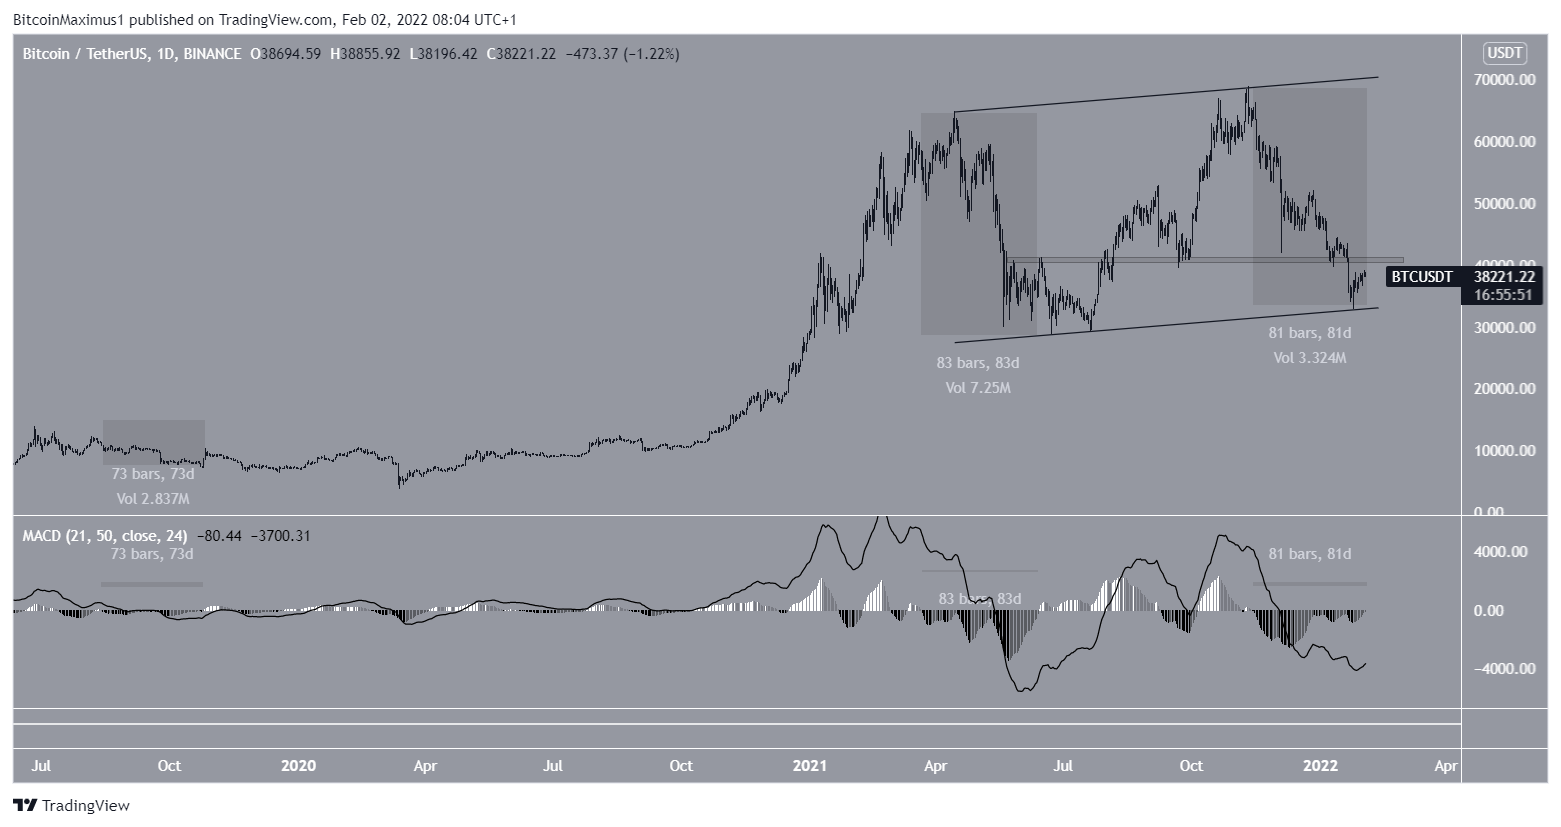
Readings from the daily MACD suggest that BTC is in an accumulation phase prior to a significant increase. This is mostly because the daily MACD has been negative for 81 days. This is the second-longest period of a negative MACD trend in the past four years, trailing only that of March-June 2021 when the MACD was negative for 83 days. This signal is very similar to that of the RSI.
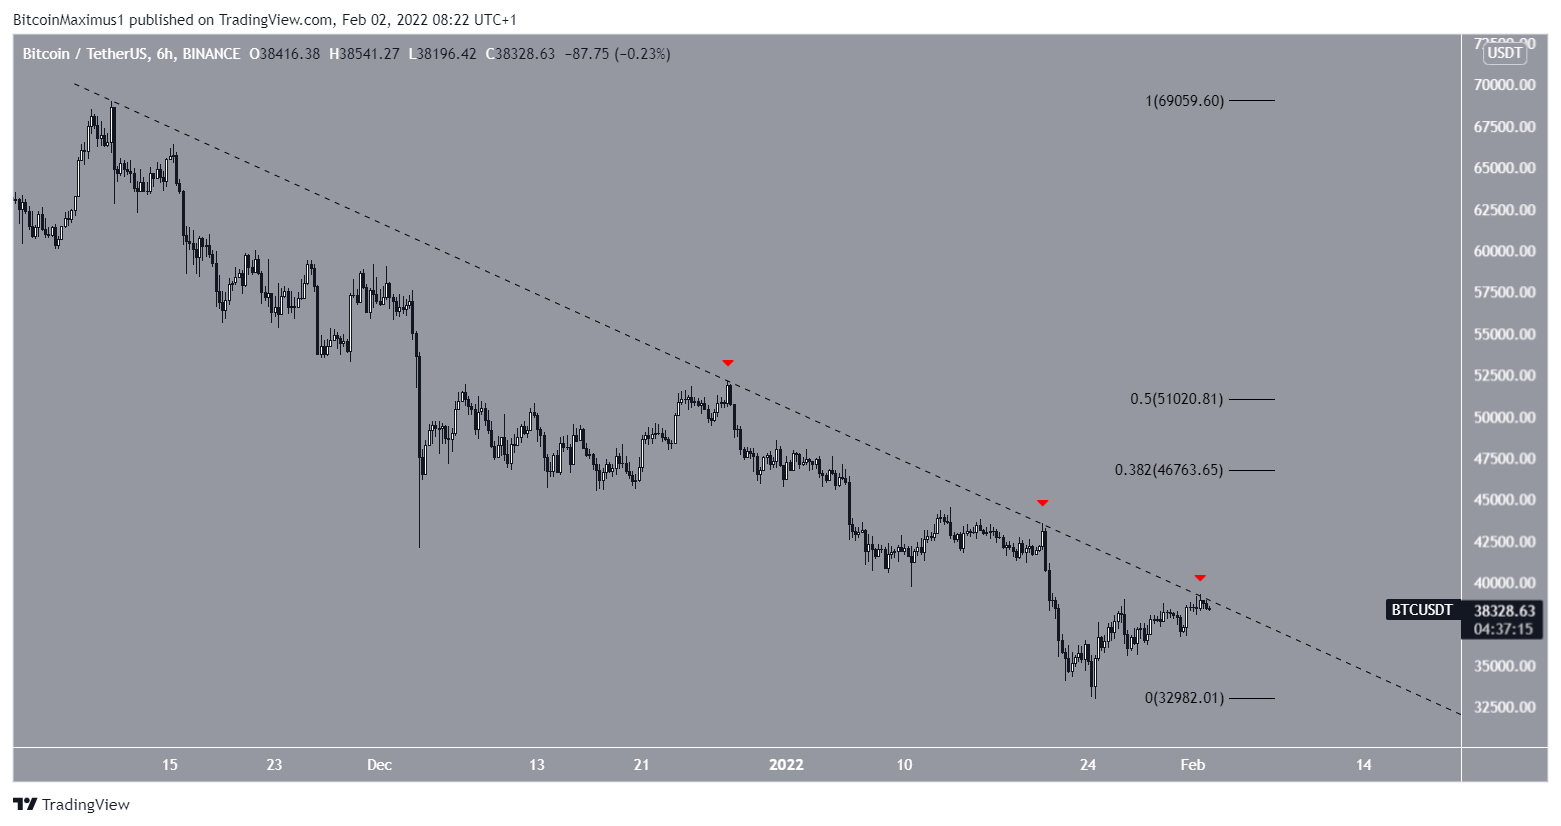
This six-hour chart shows that this is the third breakout attempt from BTC (red icons). Since resistances get weaker each time they are challenged, an eventual breakout from this line is expected.
If this occurs, the 0.382 Fib retracement resistance level at $46,763 would be the first target, while the 0.5 level at $51,000 would come after. So, a significant upward move would be likely if the line is broken.
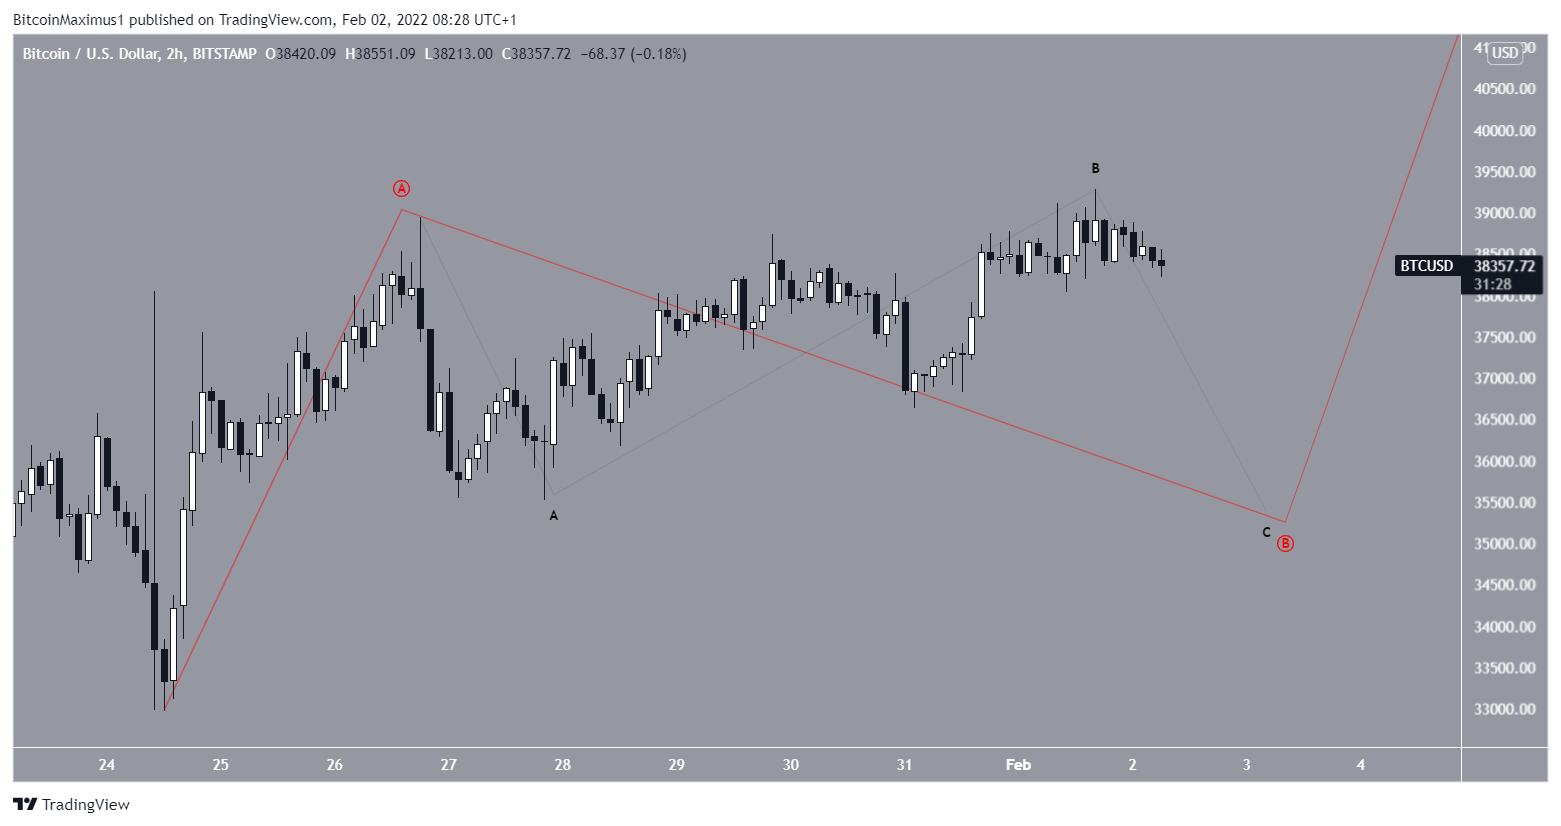
BTC wave count
There are two potential scenarios for the short-term wave count.
The first is that BTC is completing a leading diagonal measuring from the Jan 24 low and is currently in wave four. Such diagonals usually take the shape of an ascending wedge.
The most likely long-term count suggests that the bottom is already in. The creation of this leading diagonal would go a long way in suggesting that this particular count will play out.
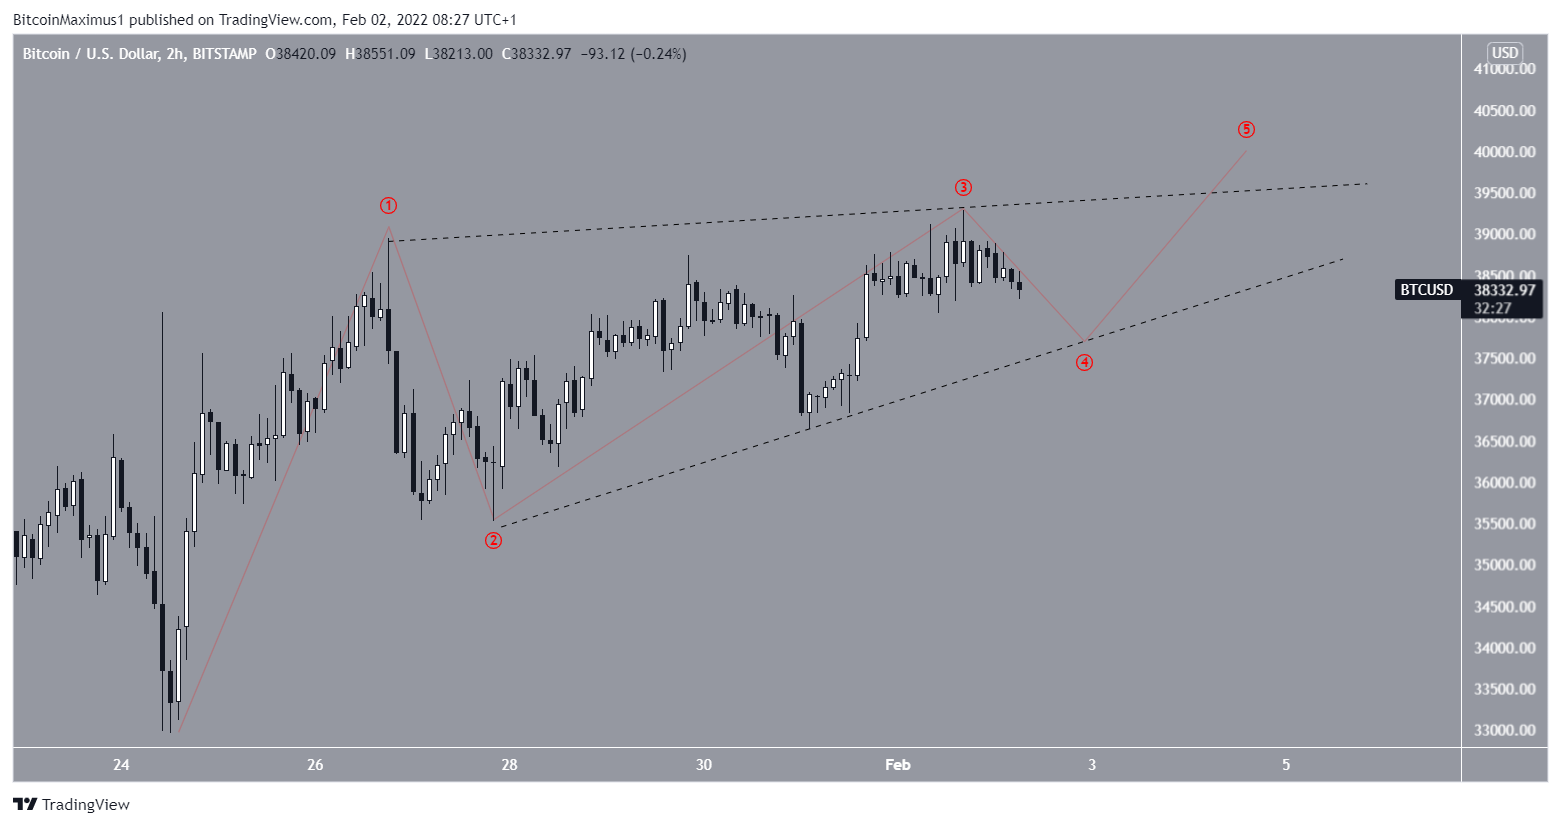
An alternate short-term count suggests that the current pattern is part of an irregular flat correction. In this case, BTC could decrease towards $35,000 before resuming its upward move.
BeInCrypto’s previous Bitcoin (BTC) analysis, click here