
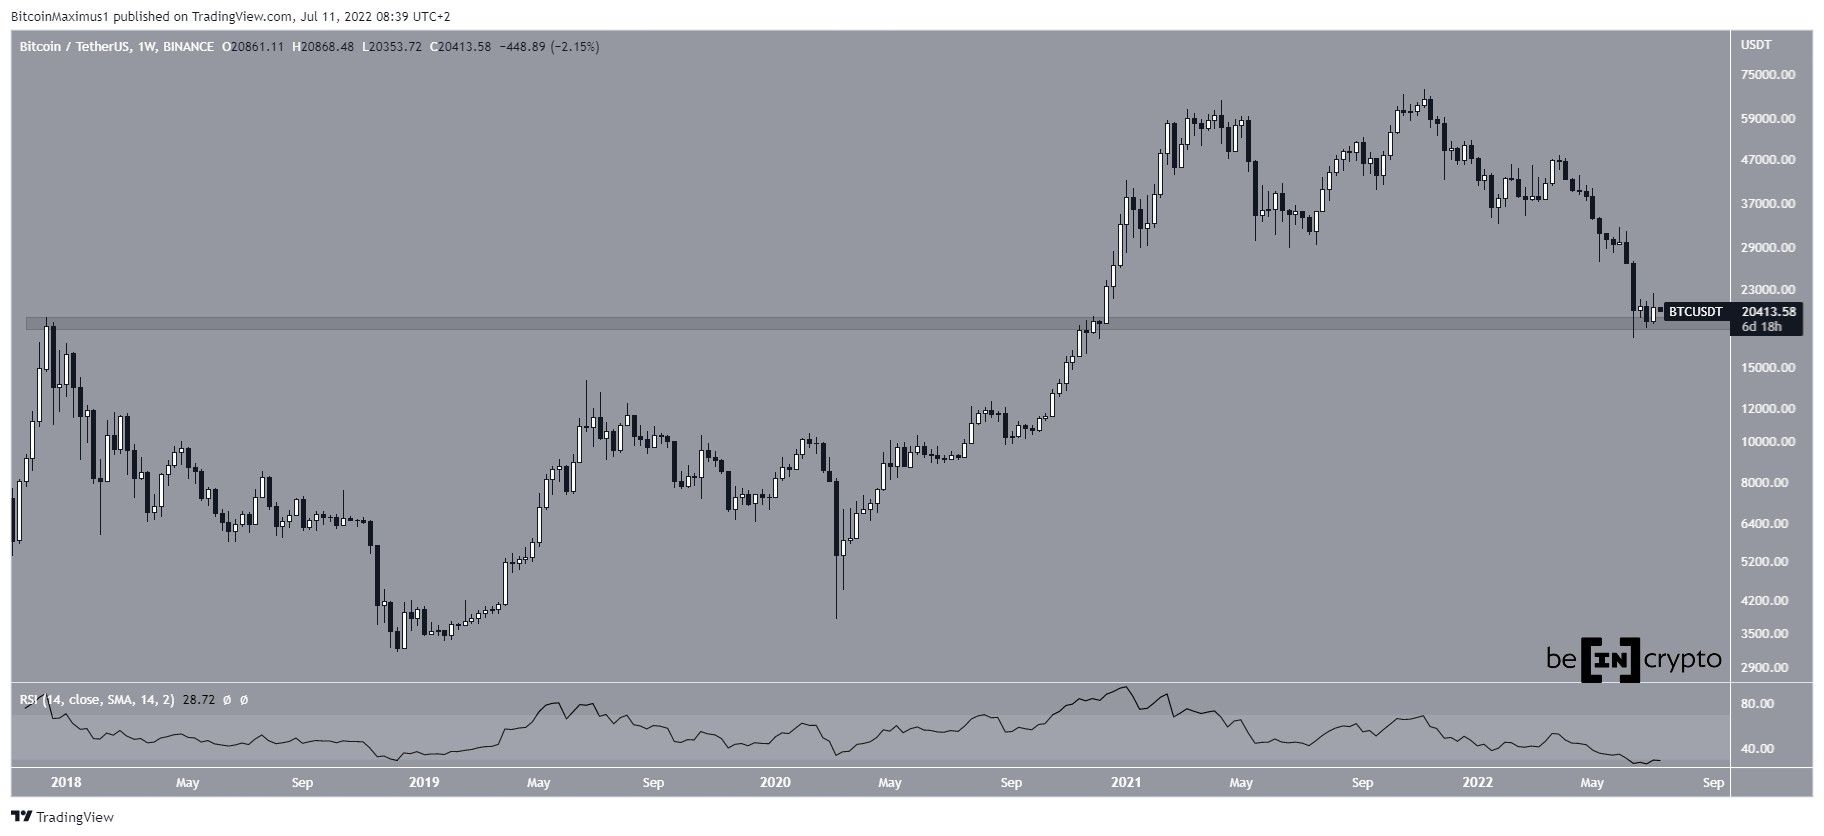
Bitcoin (BTC) created a bullish candlestick during the week of July 4-11 but failed to engulf the preceding weekly bearish candlestick and created a long upper wick.
Bitcoin has been falling since reaching an all-time high price of $69,000 in November 2021. So far, the downward movement has led to a one-and-a-half-year low of $17,622 on June 17, 2022.
The rebound that followed served to validate the $19,200 horizontal area as support. This area previously acted as the all-time high resistance from December 2017 until the price finally broke out in January 2021. Now, it’s possible that the area has turned to support.
The weekly RSI is at a new all-time low inside the oversold region. However, it has not generated any sort of bullish divergence yet.
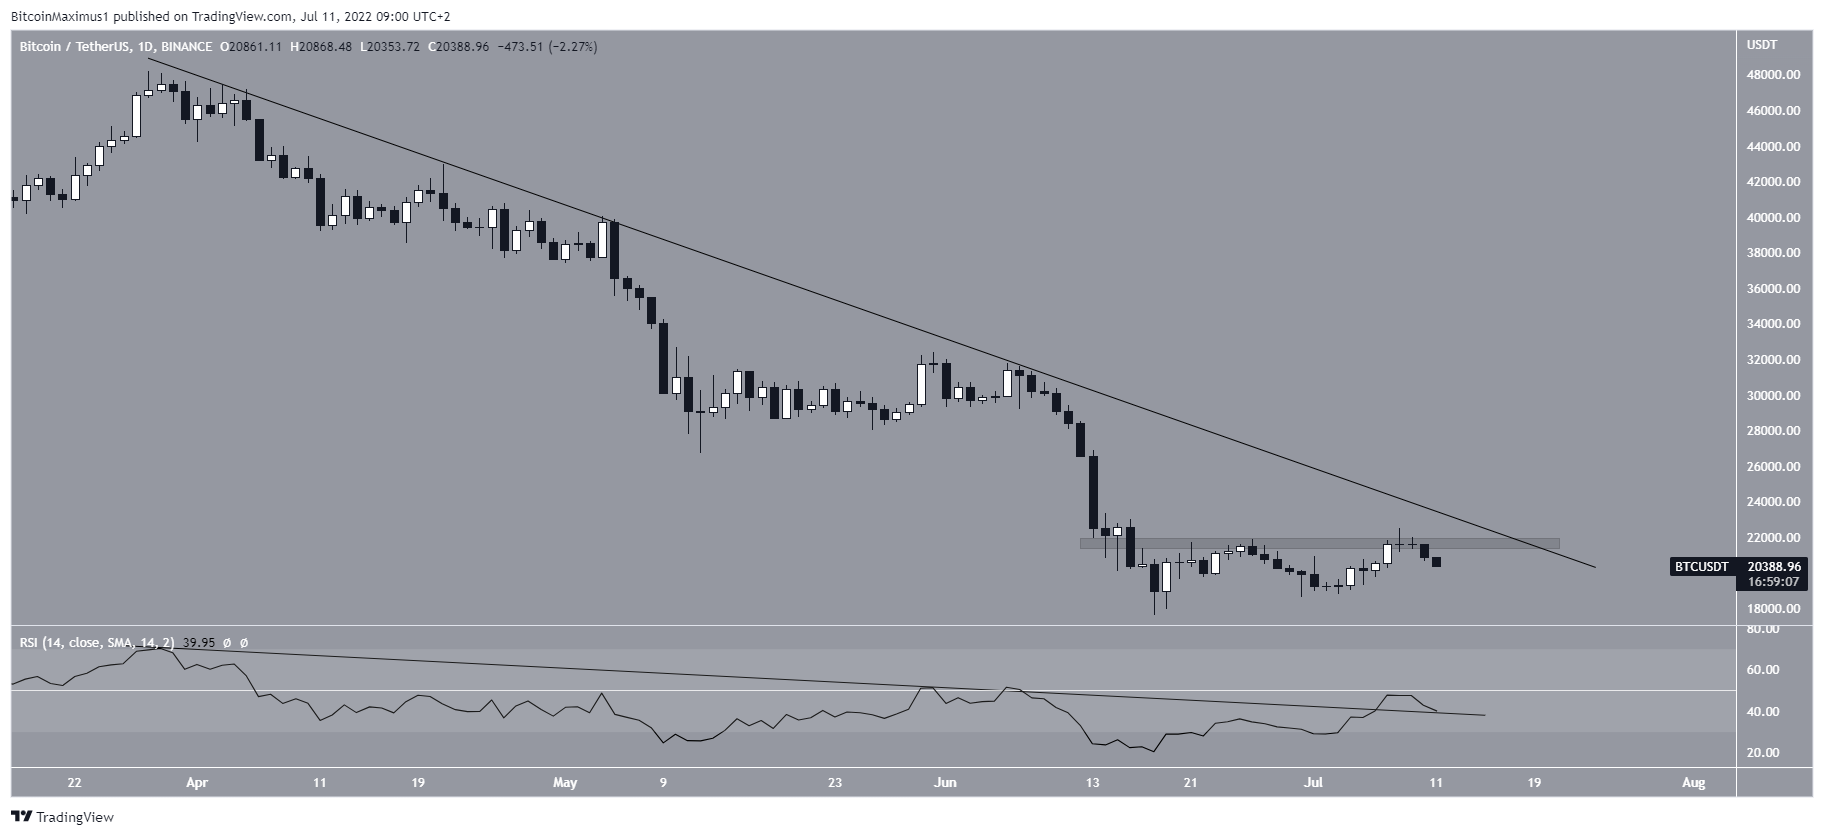
BTC moving under a long-term resistance line
The daily chart provides some conflicting signs. The price has been moving beneath a descending resistance line since the end of March. On July 8, BTC failed to reach this resistance line and was rejected by the $21,700 horizontal resistance area instead. The horizontal line now coincides with this descending resistance area.
While the RSI has broken out from a descending resistance line, something that is normally considered bullish, it has yet to move above 50. As a result, daily chart readings are leaning bearish.
Future movement
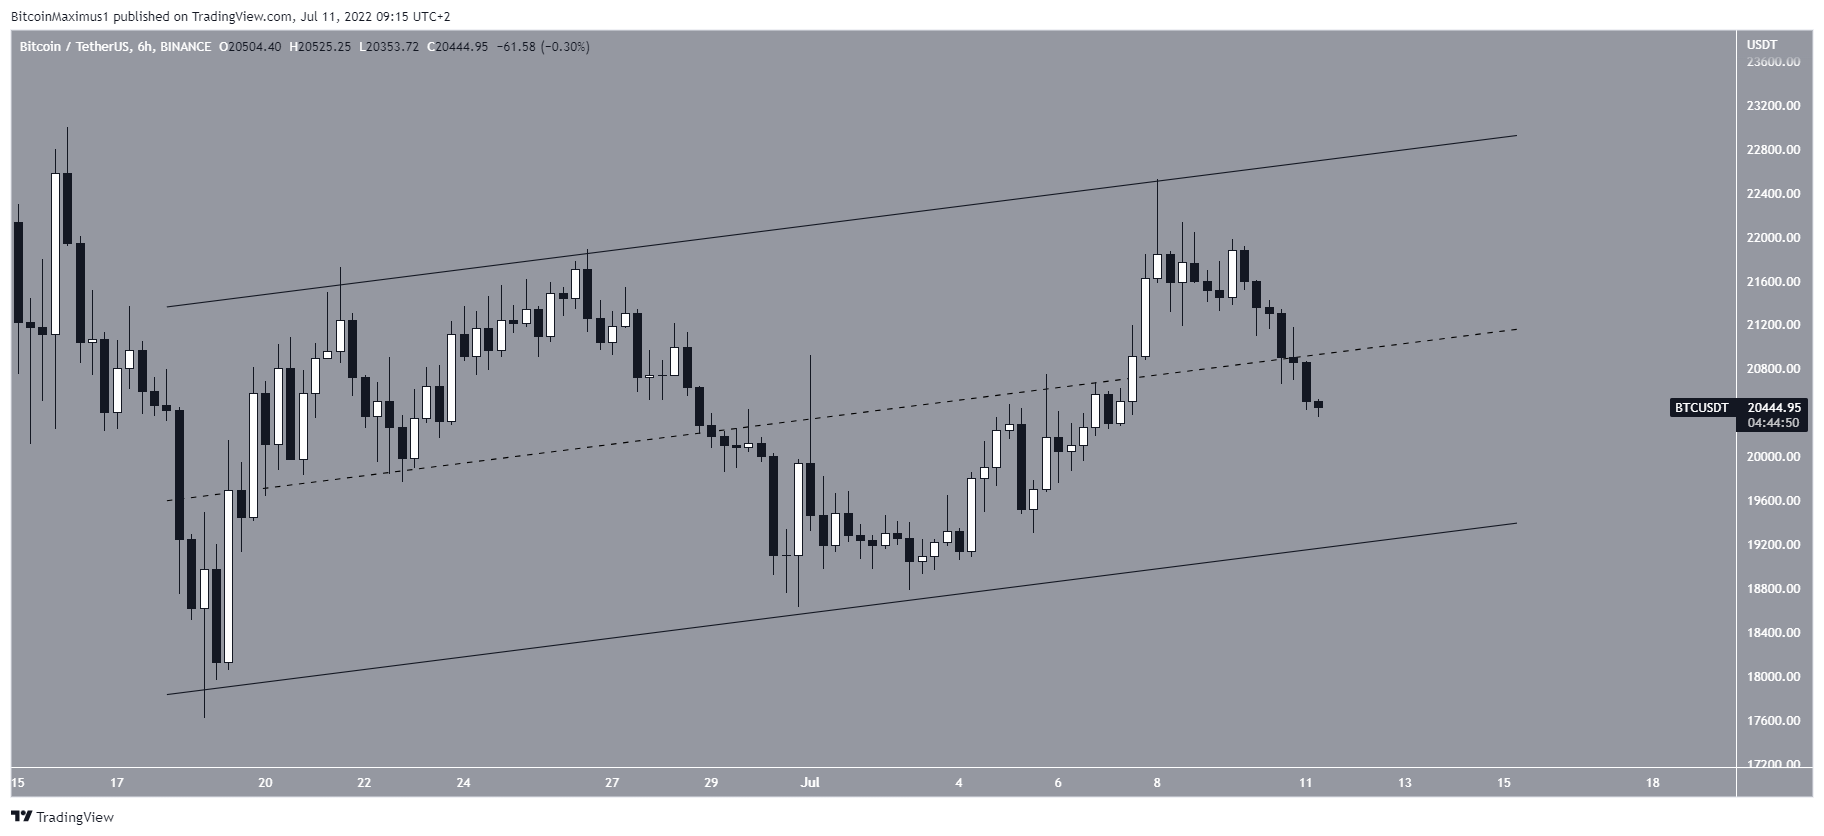
The six-hour chart paints a mostly bearish outlook. The reason for this is that the price has been increasing inside an ascending parallel channel since June 18. Such channels usually contain corrective movements, meaning that a breakdown from it would be expected.
Currently, the price is trading in the lower portion of the channel, giving even more credence to this possibility.
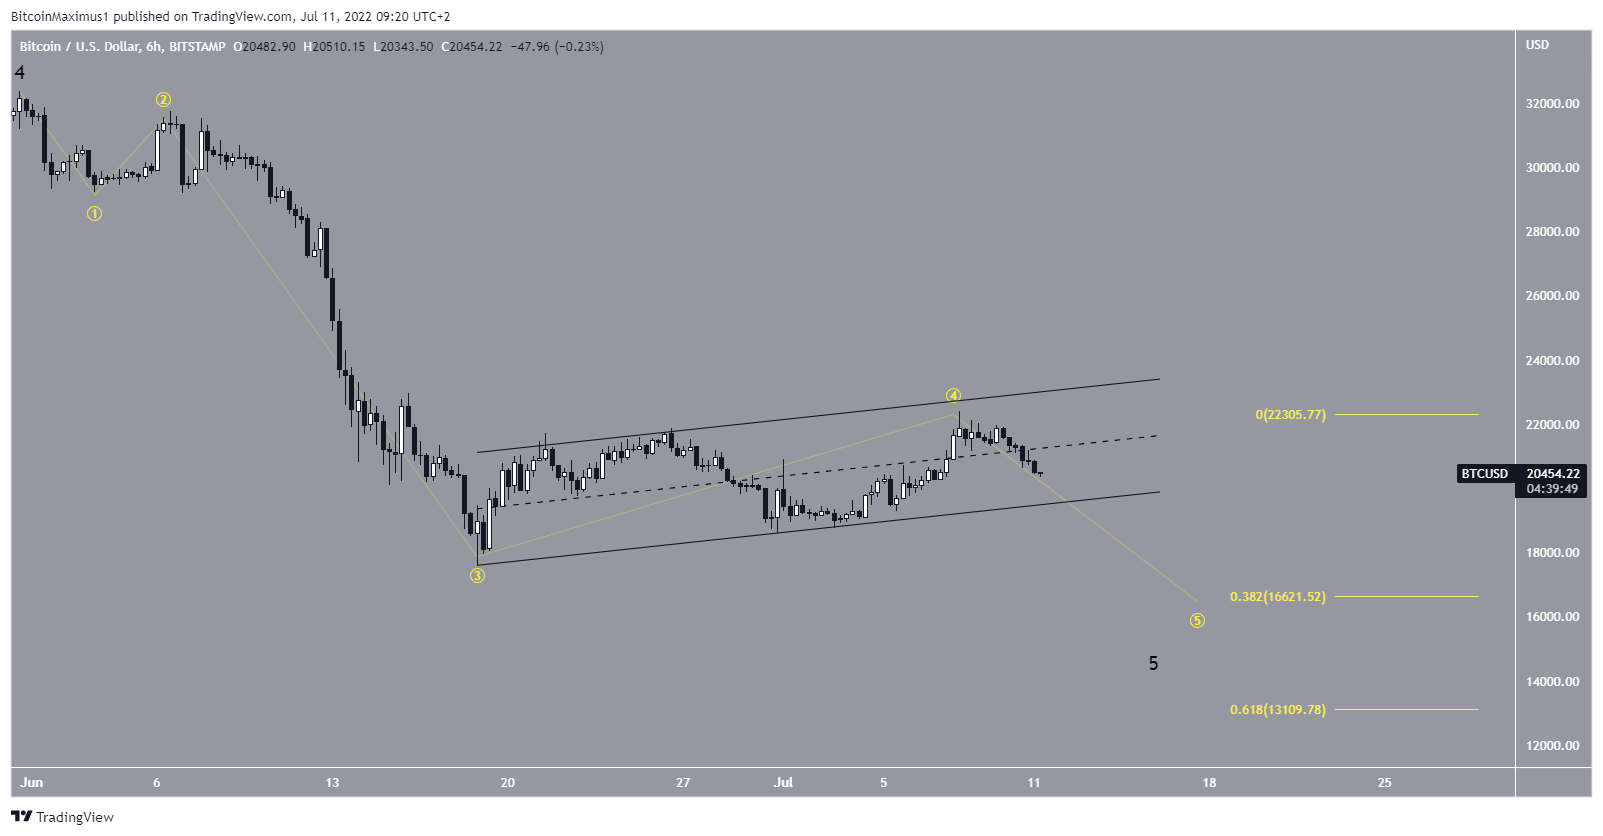
Additionally, the wave count shows that another downward movement is likely. It suggests that the price is in the final wave of a five-wave downward movement. Using the length of waves 1-3 (yellow), the 0.382 Fib would lead to a low of $16,620 while the 0.618 Fib level could lead to a long-term low of $13,100.
For Be[in]Crypto’s latest bitcoin (BTC) analysis, click here.