
Be[in]Crypto takes a look at on-chain indicators for Bitcoin (BTC), such as the Realized Price and Realized Profits-to-Value (RPV) Ratio.
What is the realized BTC price?
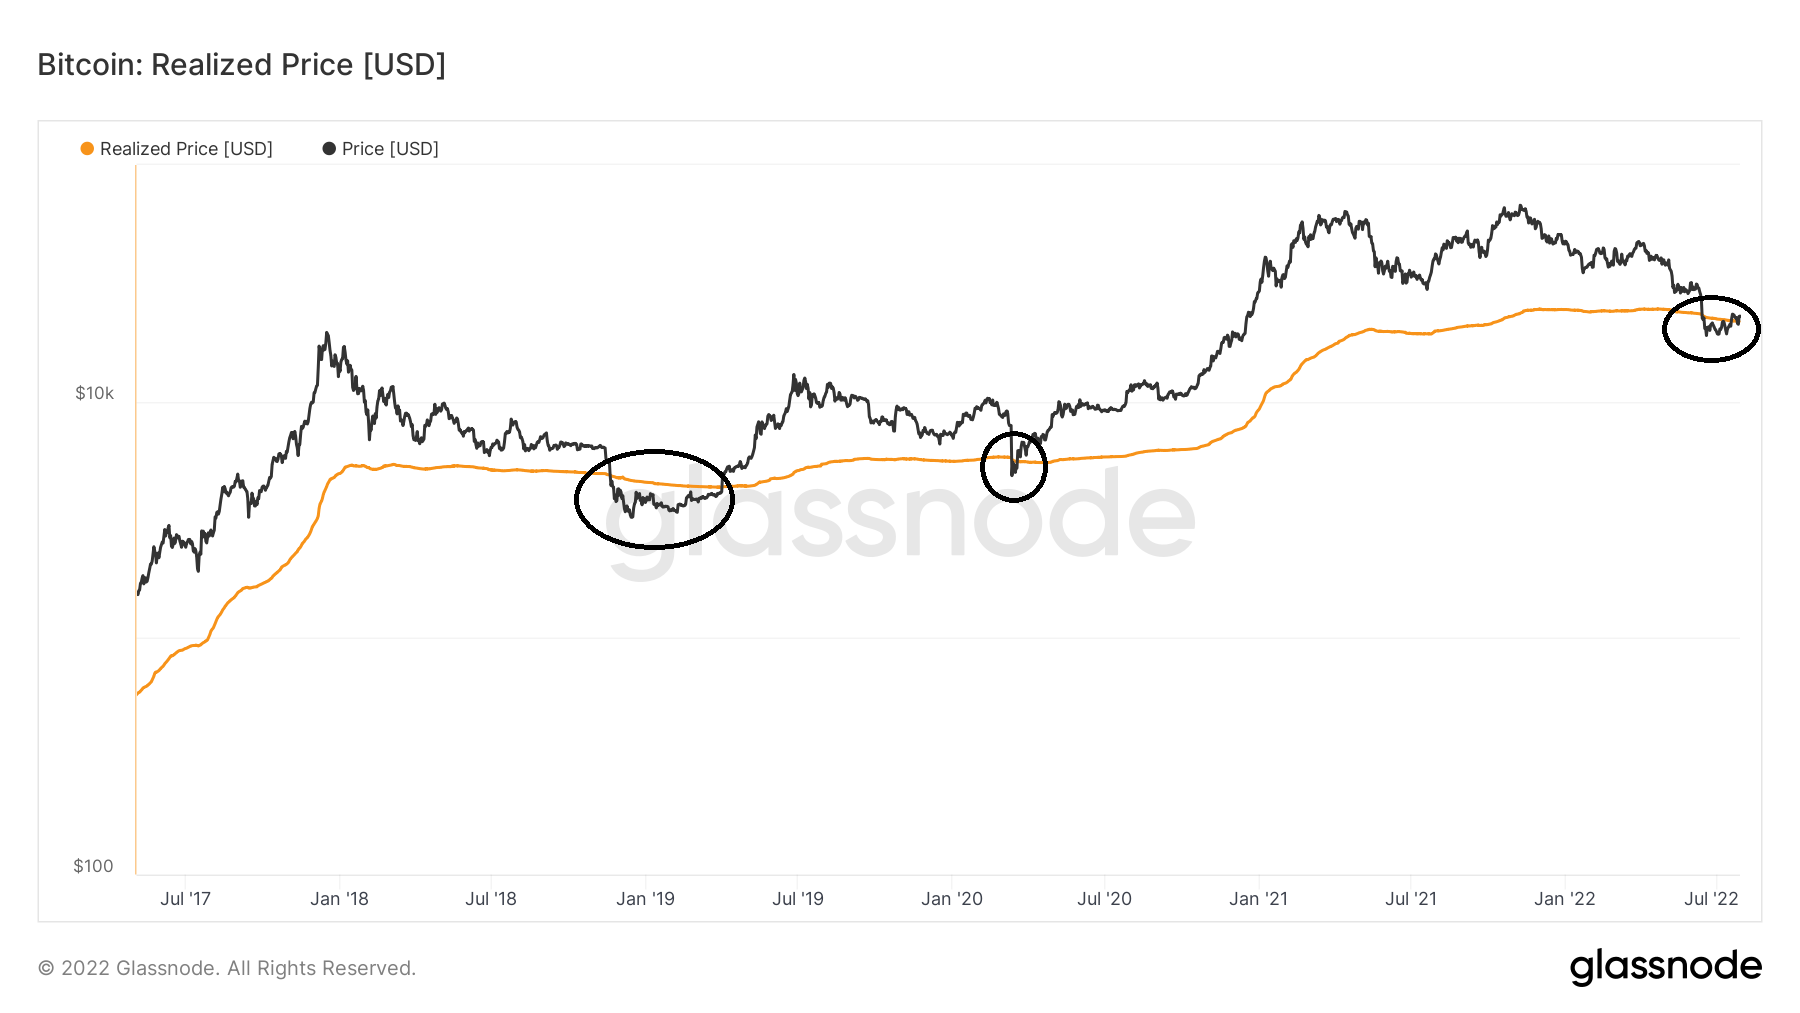
The realized price is an on-chain indicator that measures the price of BTC at the time it last moved. In turn, it devalues lost coins and coins that have not moved in a long period of time.
The actual BTC price has decreased below the realized price on only three occasions since 2018. It did so in July 2018, March 2020 and July 2022 (black circles). Currently, it is at $21,800. Therefore, while BTC fell below the realized price in July, it has reclaimed it since.
Going by previous history, each decrease below the realized price has amounted to a long-term bottom.
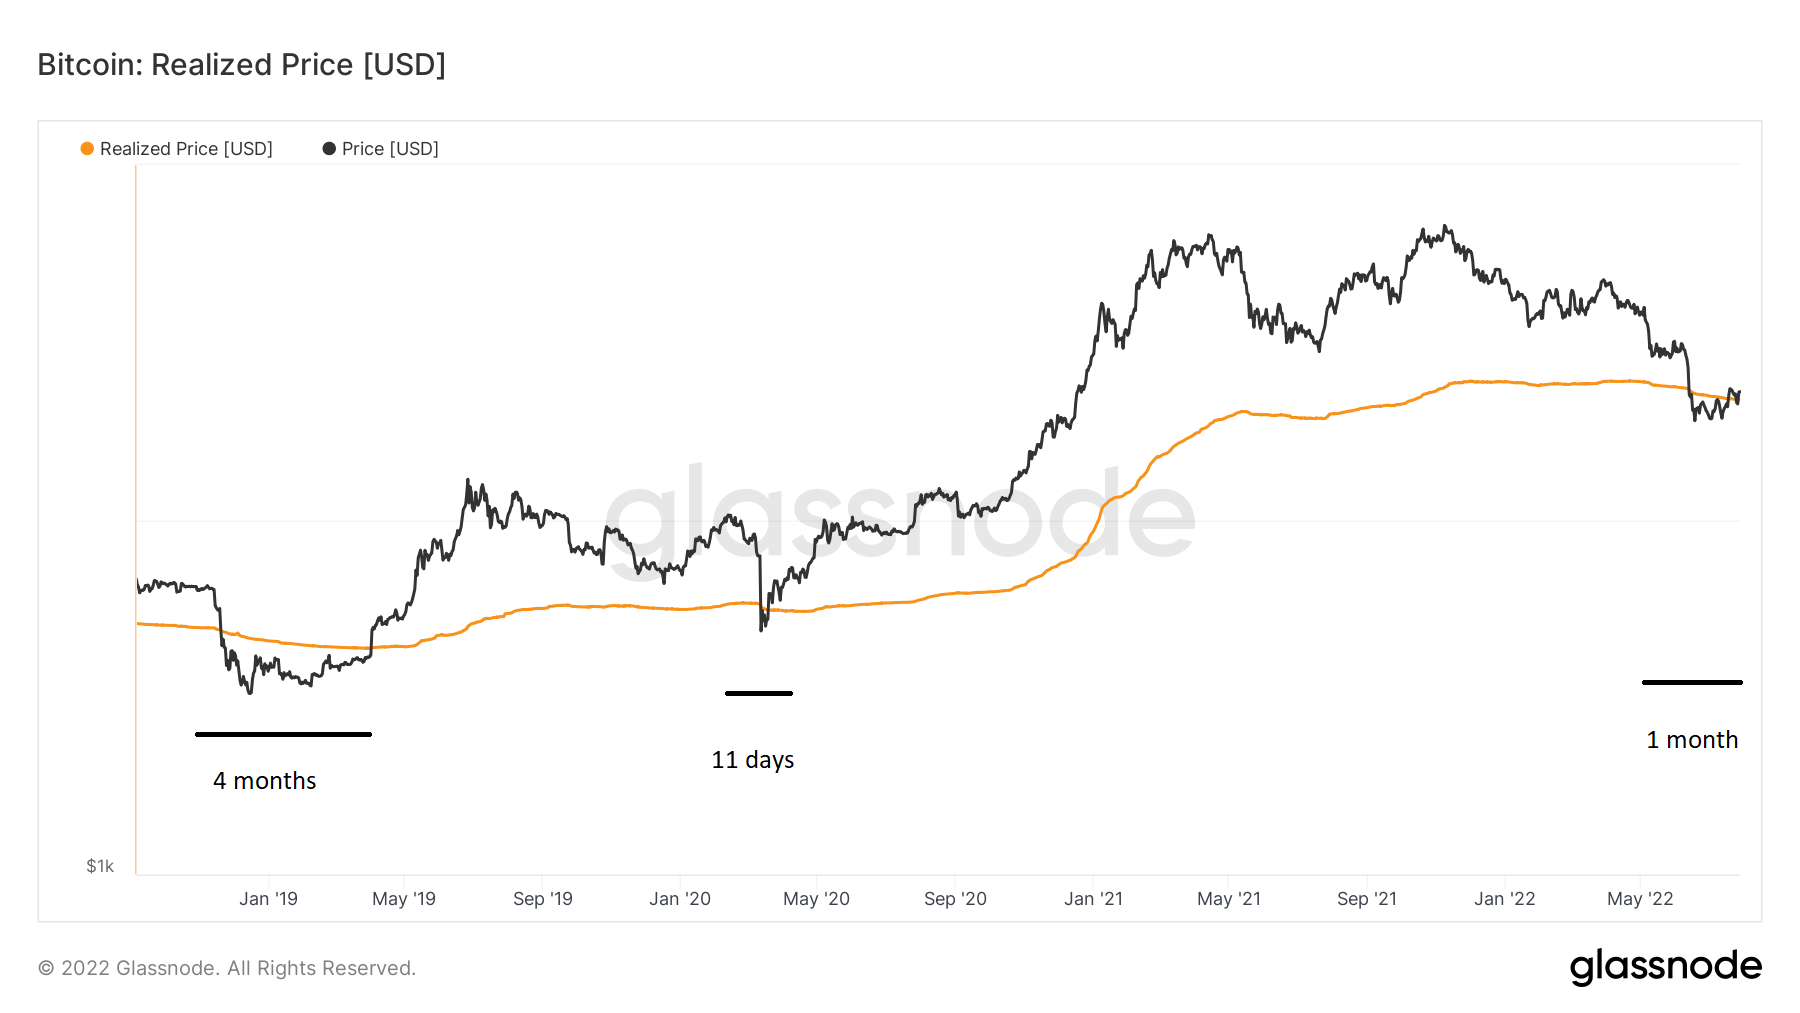
Once it broke down, the BTC price has stayed below the realized price for different periods of time:
- In 2018, it did so for four months
- In 2021, it did so for 11 days
- Finally, in 2022, it stayed below the realized price for one month
Therefore, there is no consensus on the amount of time the deviation below the realized price occurs. However, an interesting conclusion is that once the BTC price manages to reclaim the realized price, it does not fall below it again.
So, this would mean that BTC has already bottomed.
Realized profits-to-value ratio (RPV)
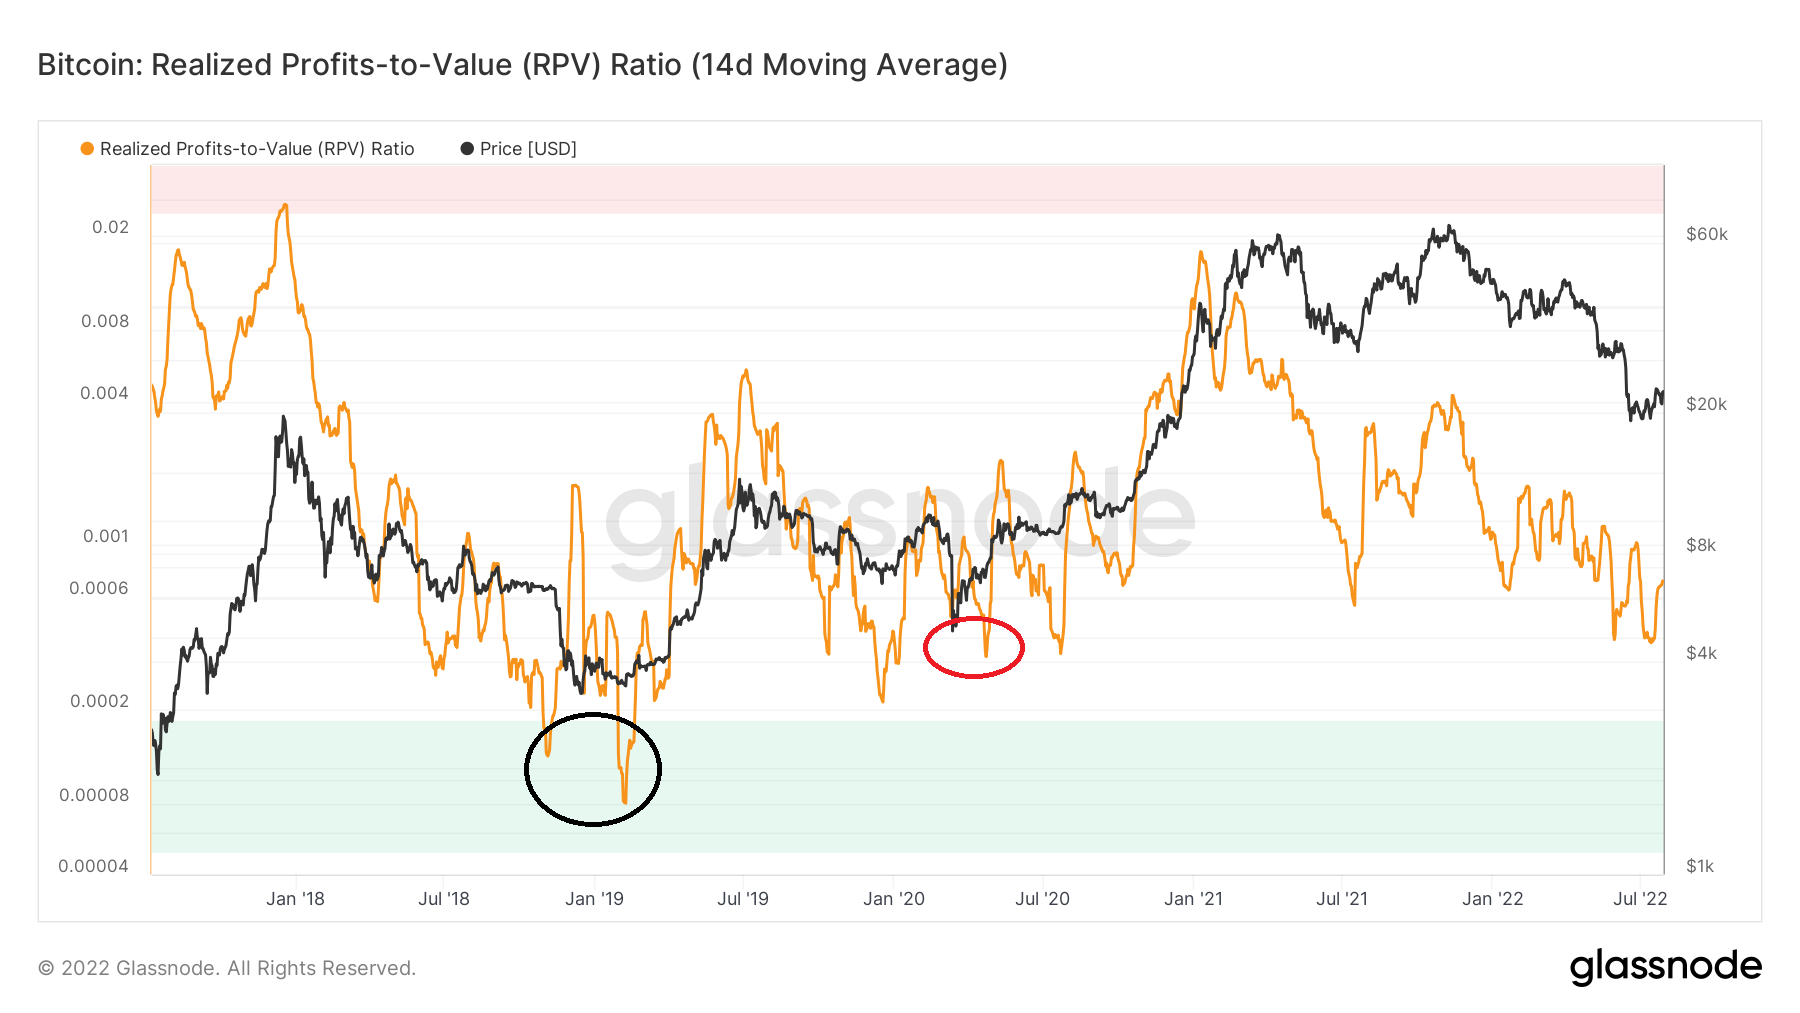
The Realized Profits-to-Value Ratio (RPV) is the ratio between realized profits and the realized capitalization. In it, values below 0.0002 are considered oversold and have been historically associated with bottoms. This was the case in Dec 2018 (black circle).
The current reading of 0.0004 is considerably above this oversold level. However, it is the same as that in March 2020. (red circle).
So, this indicator suggests that the current bottom is more similar to that of March 2020 rather than that of Dec 2018, making it a local bottom. A similar conclusion is also reached when looking at the time the BTC price spent below the realized price.
For Be[in]Crypto’s latest Bitcoin (BTC) analysis, click here