
The Balancer (BAL) price has been increasing since breaking out from a descending resistance line on Dec. 29. BAL has reclaimed numerous resistance areas and looks like it will rally towards at least $26.
Breakout and Reclaim of Resistance
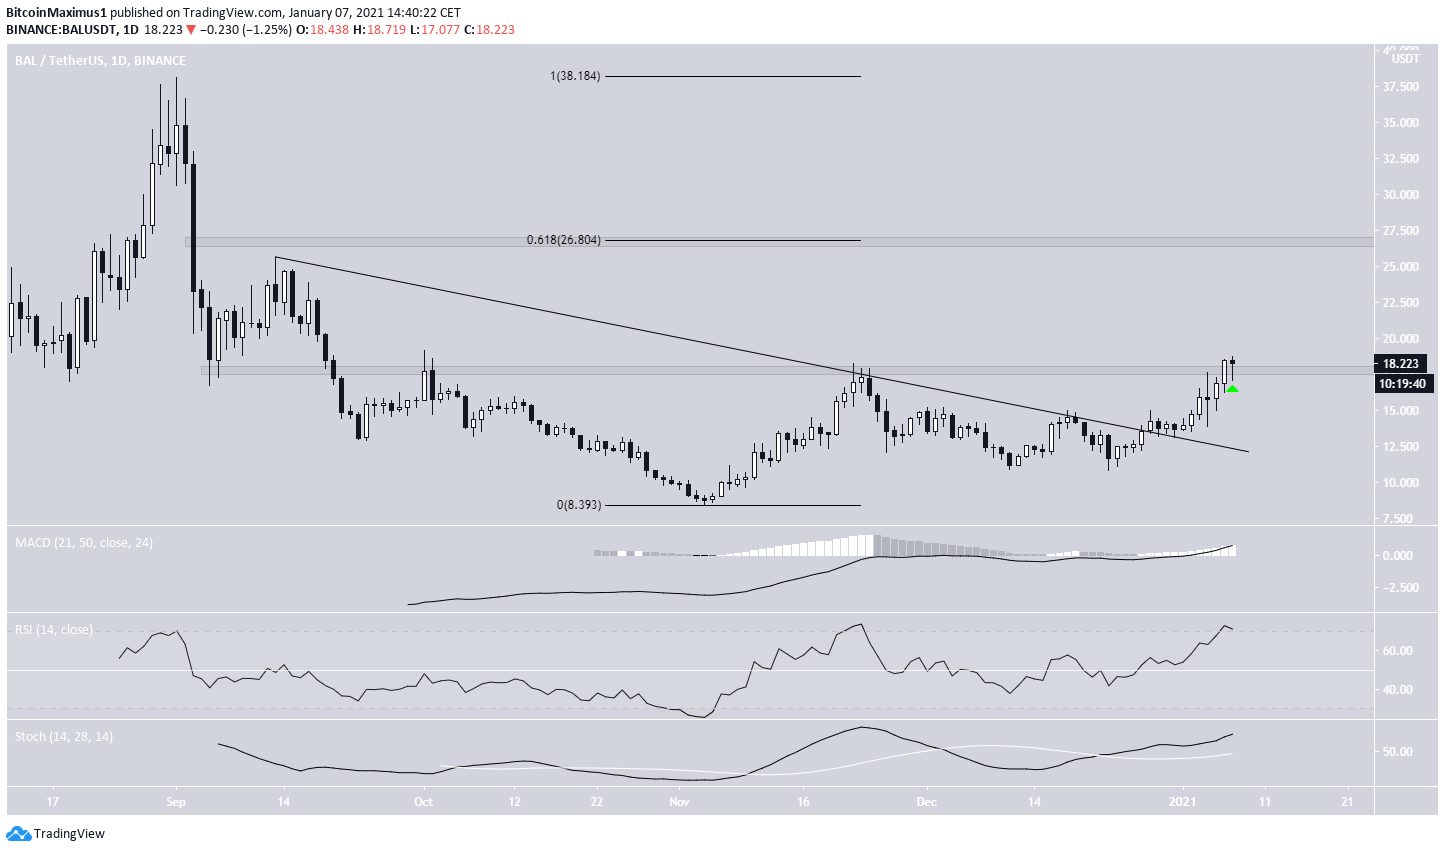
BAL had been following a descending resistance line since Sept. 13. It made two unsuccessful breakout attempts before finally moving above the line on Dec. 28.
On Jan. 6, it also moved above the $18 area, which previously acted as resistance. BAL is currently in the process of validating it as support.
If it continues rallying, the next resistance area would be at $26.80, the 0.618 Fib retracement level of the entire downward move. The following resistance area is at the all-time high price of $38.18.
Technical indicators on the daily time-frame are bullish, supporting the possibility that the upward momentum will continue.
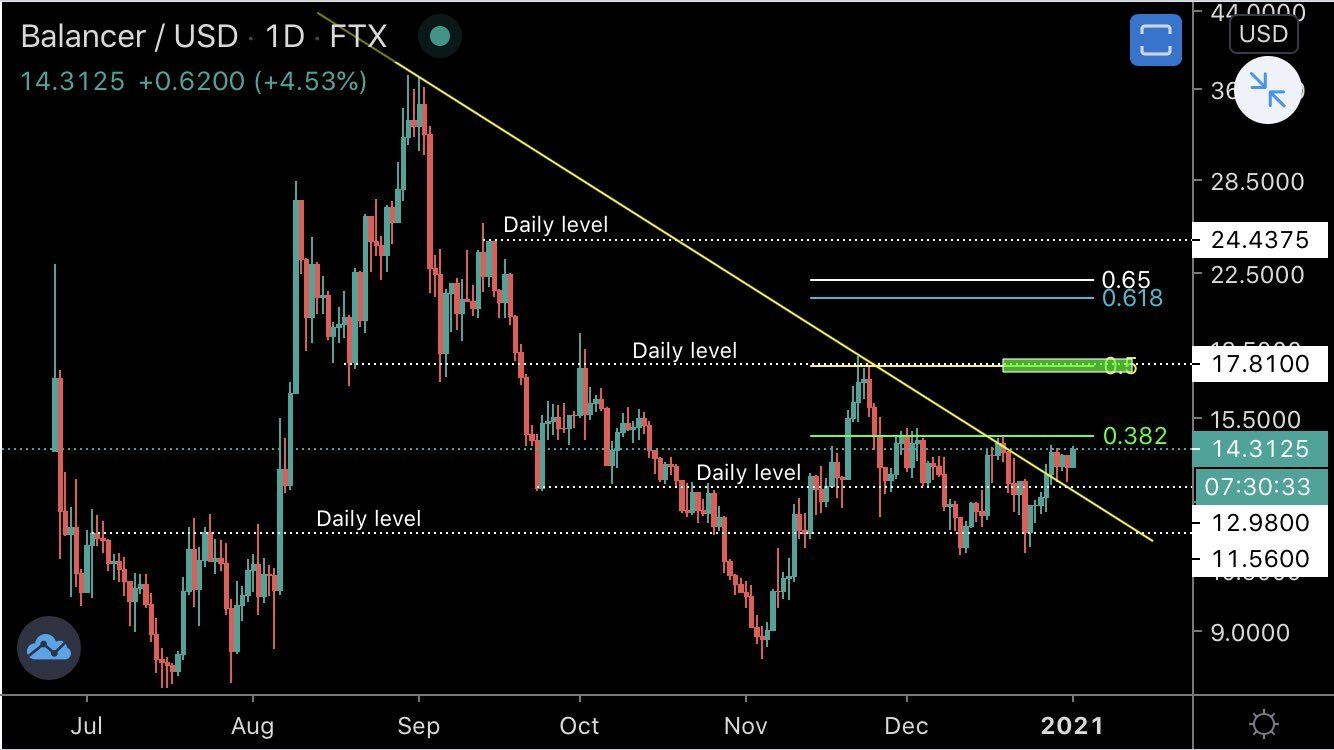
Cryptocurrency trader @Mesawine1 outlined a BAL chart, which shows the same breakout from a descending resistance line.
Since the tweet, BAL has already reclaimed the first resistance area at $18 and is now moving towards the next one at $26.80. A breakout above this level would likely take BAL towards a new all-time high.
Short-Term Movement
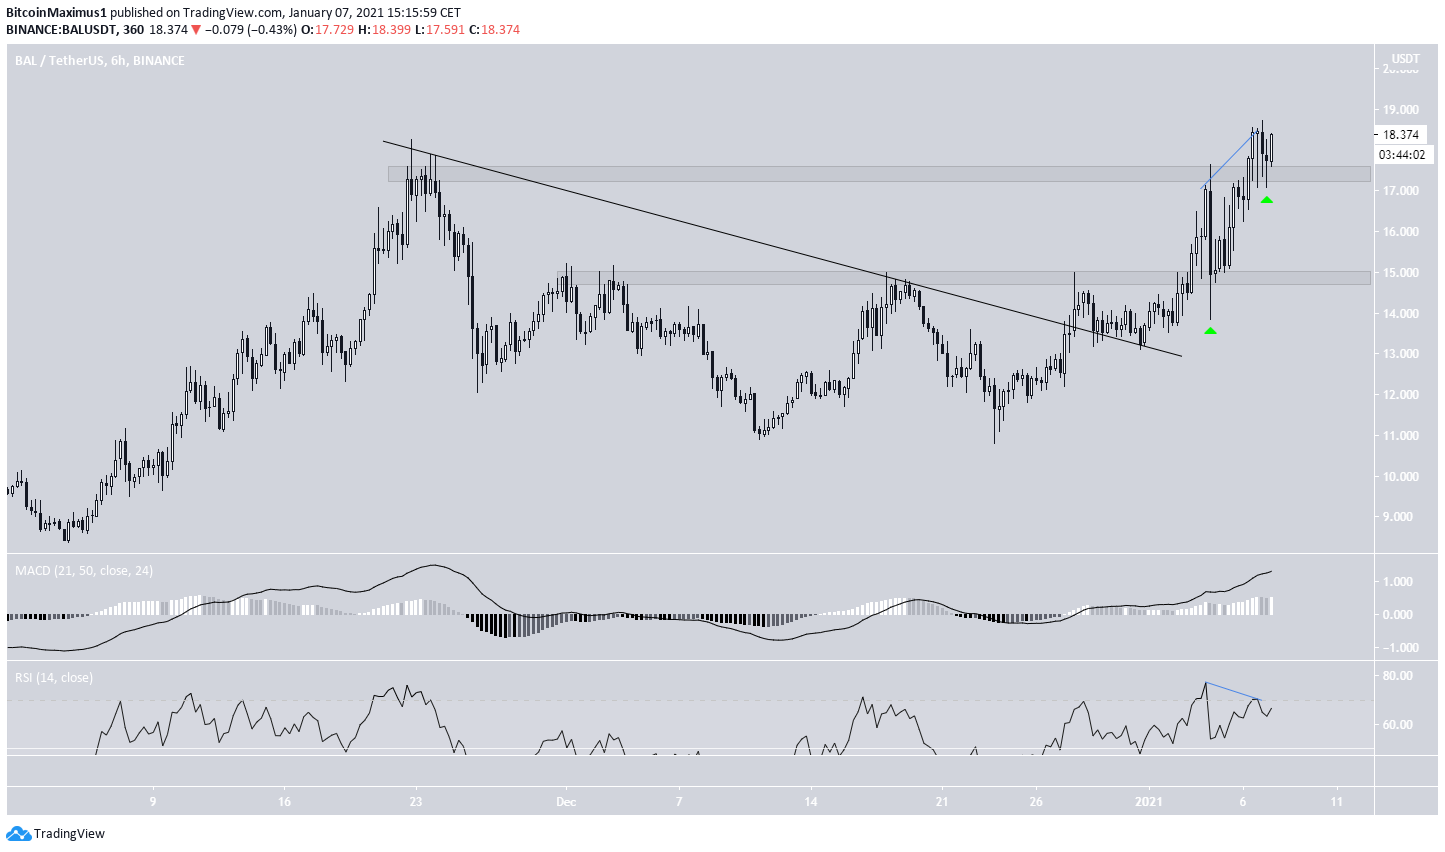
The shorter-term six-hour chart supports the possibility of upwards continuation.
BAL has broken out from a short-term descending resistance line and has followed that up with a reclaim of the $15 and the $17.50 area. As long as it’s trading above the latter, it should continue moving upwards.
Despite some bearish divergence on lower time-frames, technical indicators are still bullish, similar to those on the daily time-frame.
Wave Count
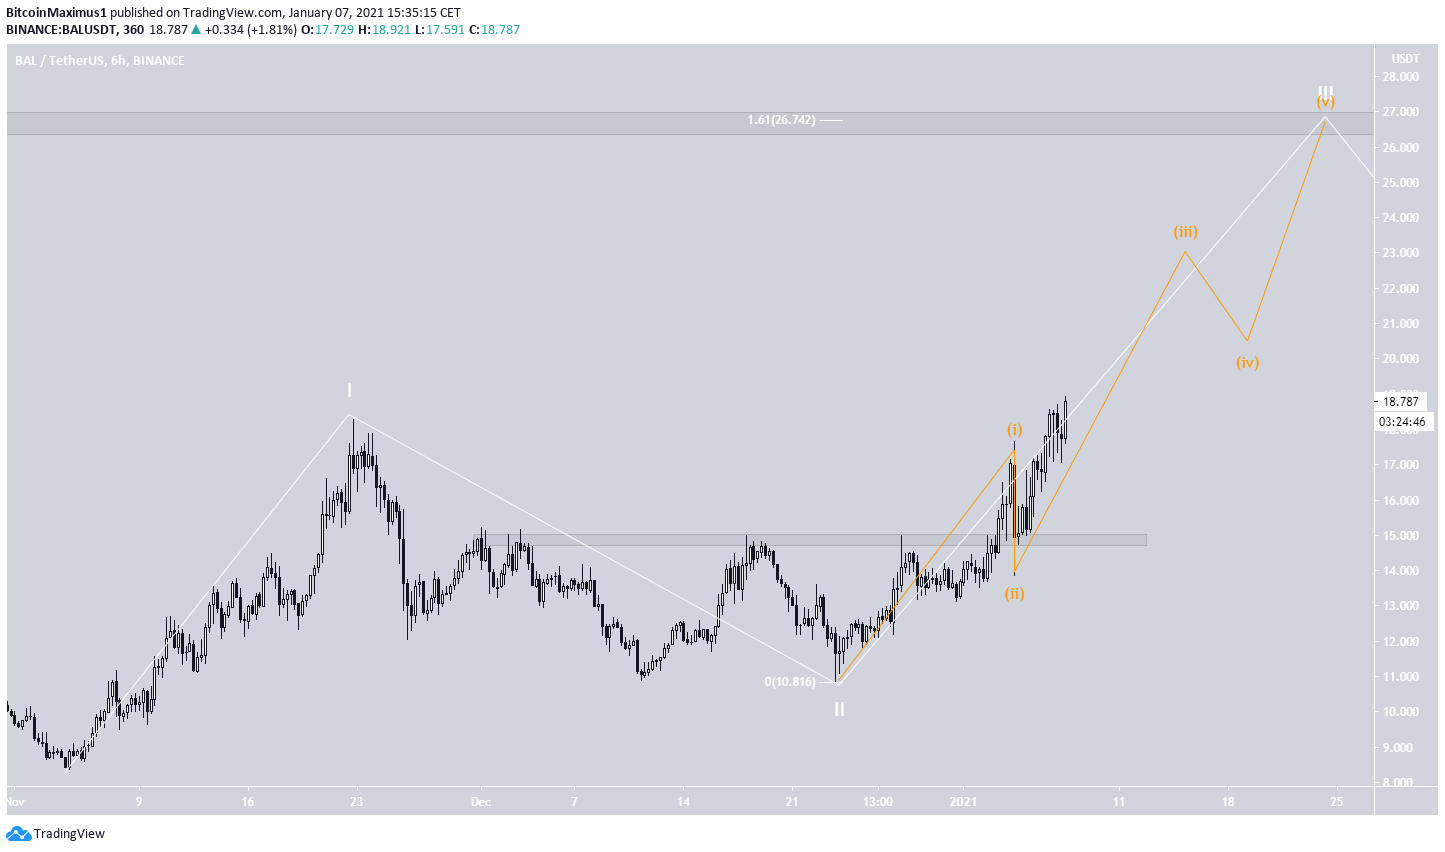
The most likely wave count suggests that BAL is currently in an extended wave 3 (shown in white below), which has a possible target of $26.75. The target is found by giving waves 1:3 a 1:1.61 ratio, common in such impulses. Furthermore, it coincides with the previously outlined resistance area.
The sub-wave count is given in orange. The loss of the $15 minor support area would invalidate this particular wave count.
Conclusion
To conclude, BAL should continue rallying until it reaches the next closest resistance area at $26.70. A breakout above this level could take it towards a new all-time high price.
For BeInCrypto’s latest Bitcoin (BTC) analysis, click here!
Disclaimer: Cryptocurrency trading carries a high level of risk and may not be suitable for all investors. The views expressed in this article do not reflect those of BeInCrypto.