
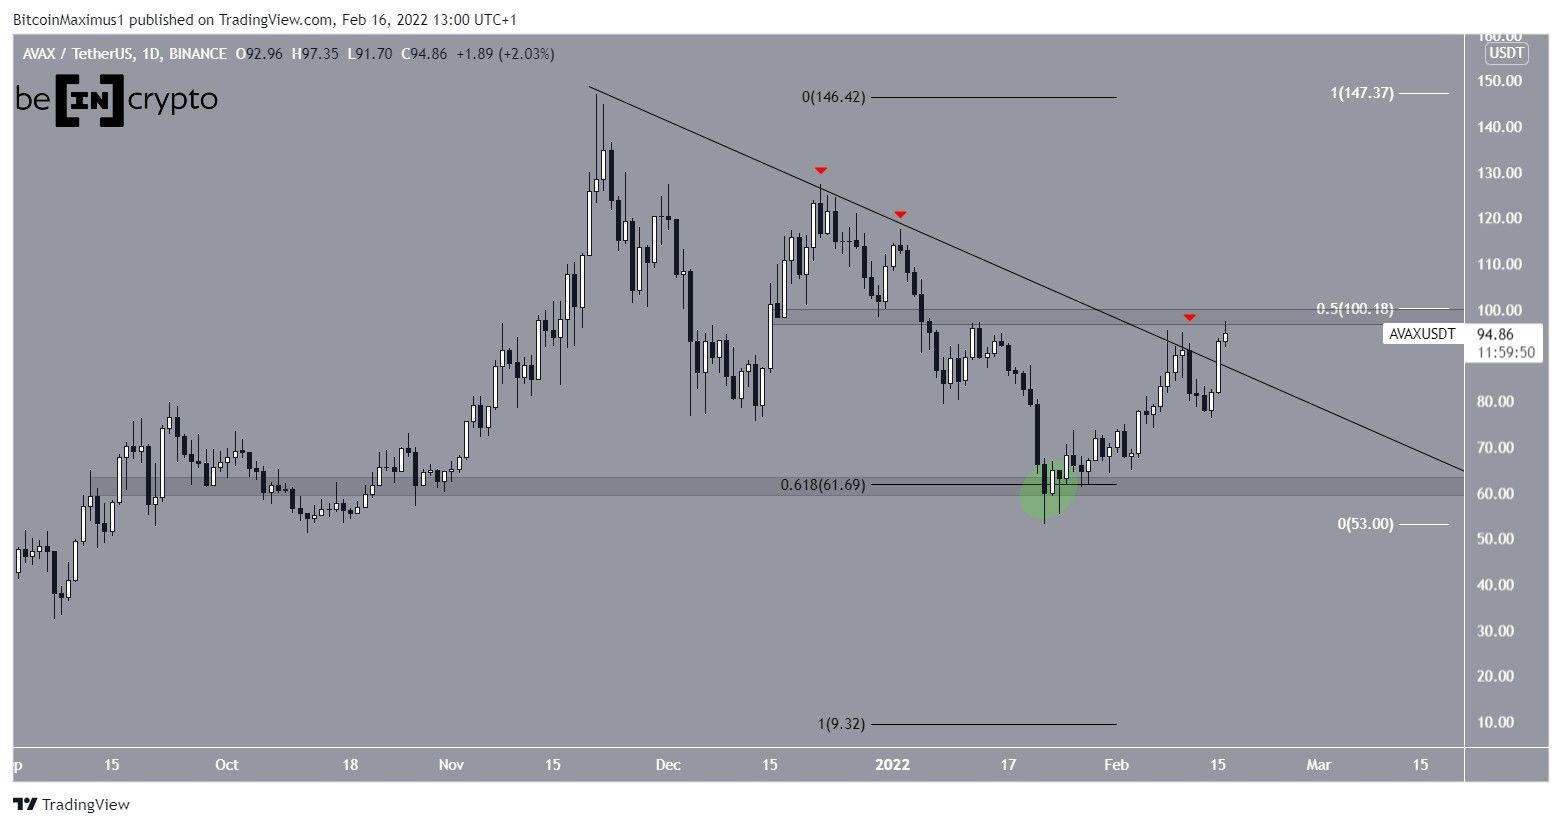
Avalanche (AVAX) is trading inside an important horizontal and Fib resistance level. Whether it breaks out from it or gets rejected will likely determine the direction of the future trend.
AVAX has been decreasing alongside a descending resistance line since reaching an all-time high price of $147 on Nov 21. The line has rejected the price thrice so far (red icons), more recently on Feb 10.
While following the line, AVAX reached a low of $52.95 on Jan 22. The low served to validate the $62 area as support. This is both a horizontal support area and the 0.618 Fib retracement support level when measuring from the July 2021 lows.
The price has been moving upwards since and managed to break out from the line on Feb 15. It is currently trading close to the $95-$100 area, which is both a horizontal and a Fib resistance level.
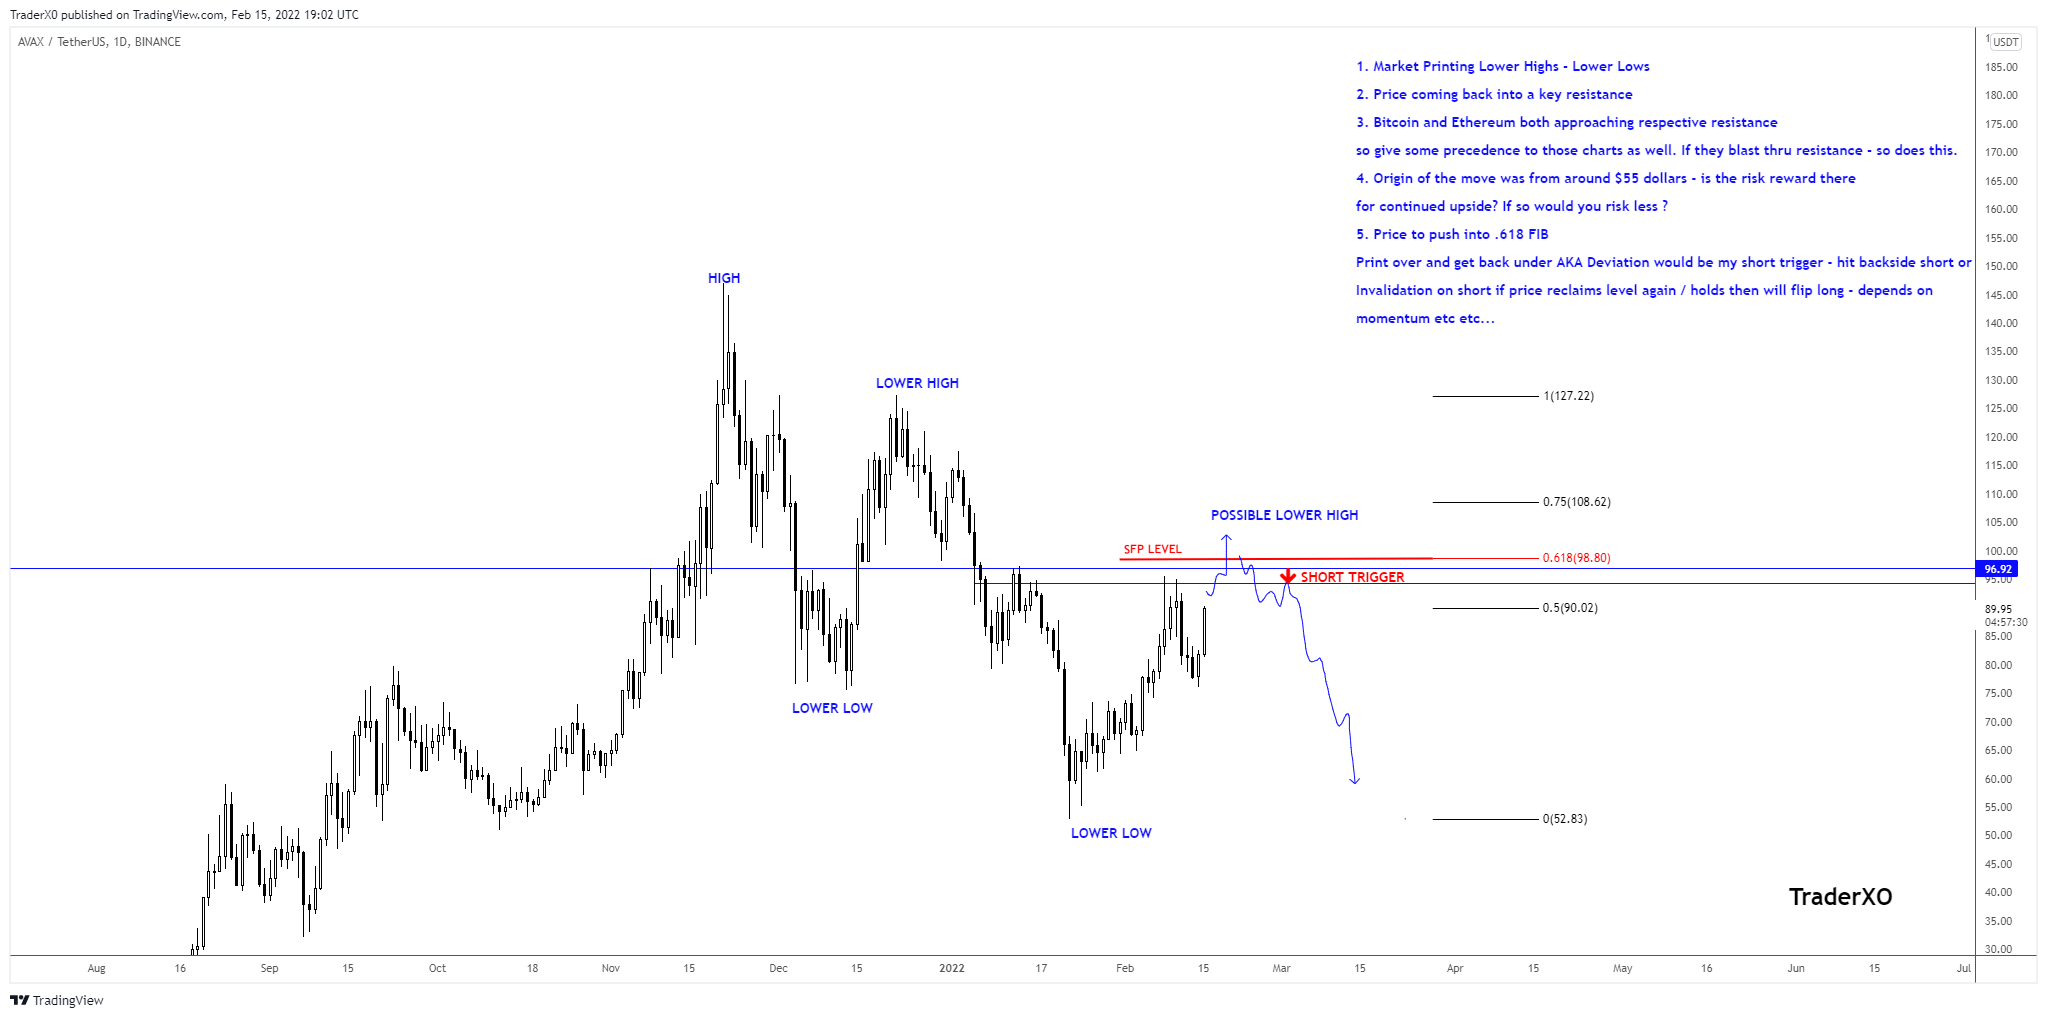
Cryptocurrency trader @Traxer_X0 tweeted a chart of AVAX, stating that the token is likely to get rejected close to the $100 resistance area. Since the price has currently reached this area, a closer look at technical indicators is required in order to determine if it will eventually break out.
Ongoing breakout
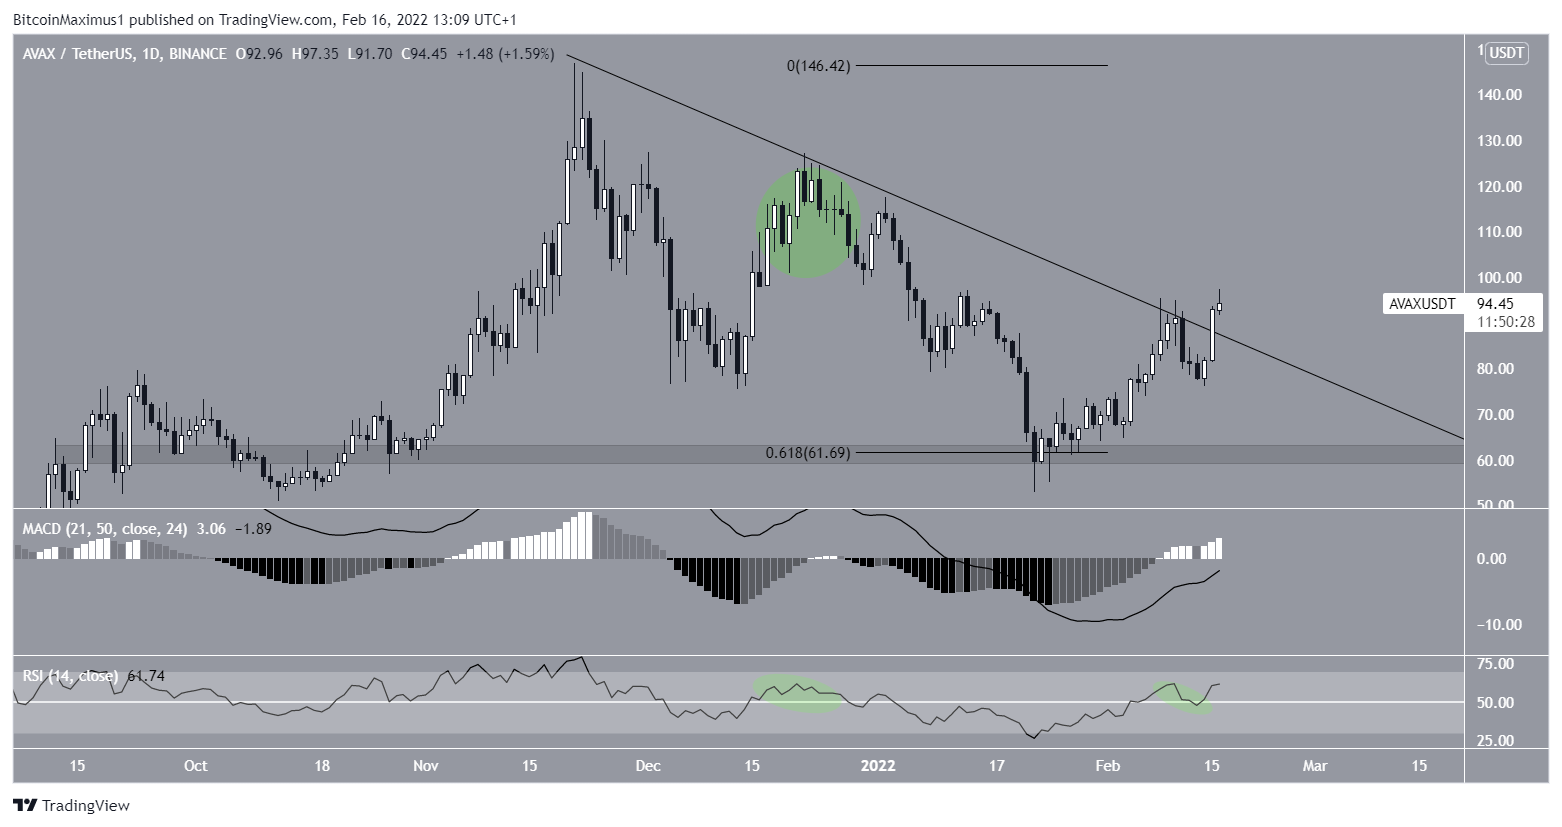
Technical indicators show a neutral/bullish trend. In the bullish side, the RSI has just moved above 50. This is considered a sign of bullish momentum. However, the previous time it occurred (green circle), it only led to a failed breakout and a sharp reversal afterwards.
The MACD, which is created by a short- and a long-term moving average (MA), is increasing but is not positive yet. This means that while the short-term MA is accelerating relative to the long-term one, it is still not faster than it.
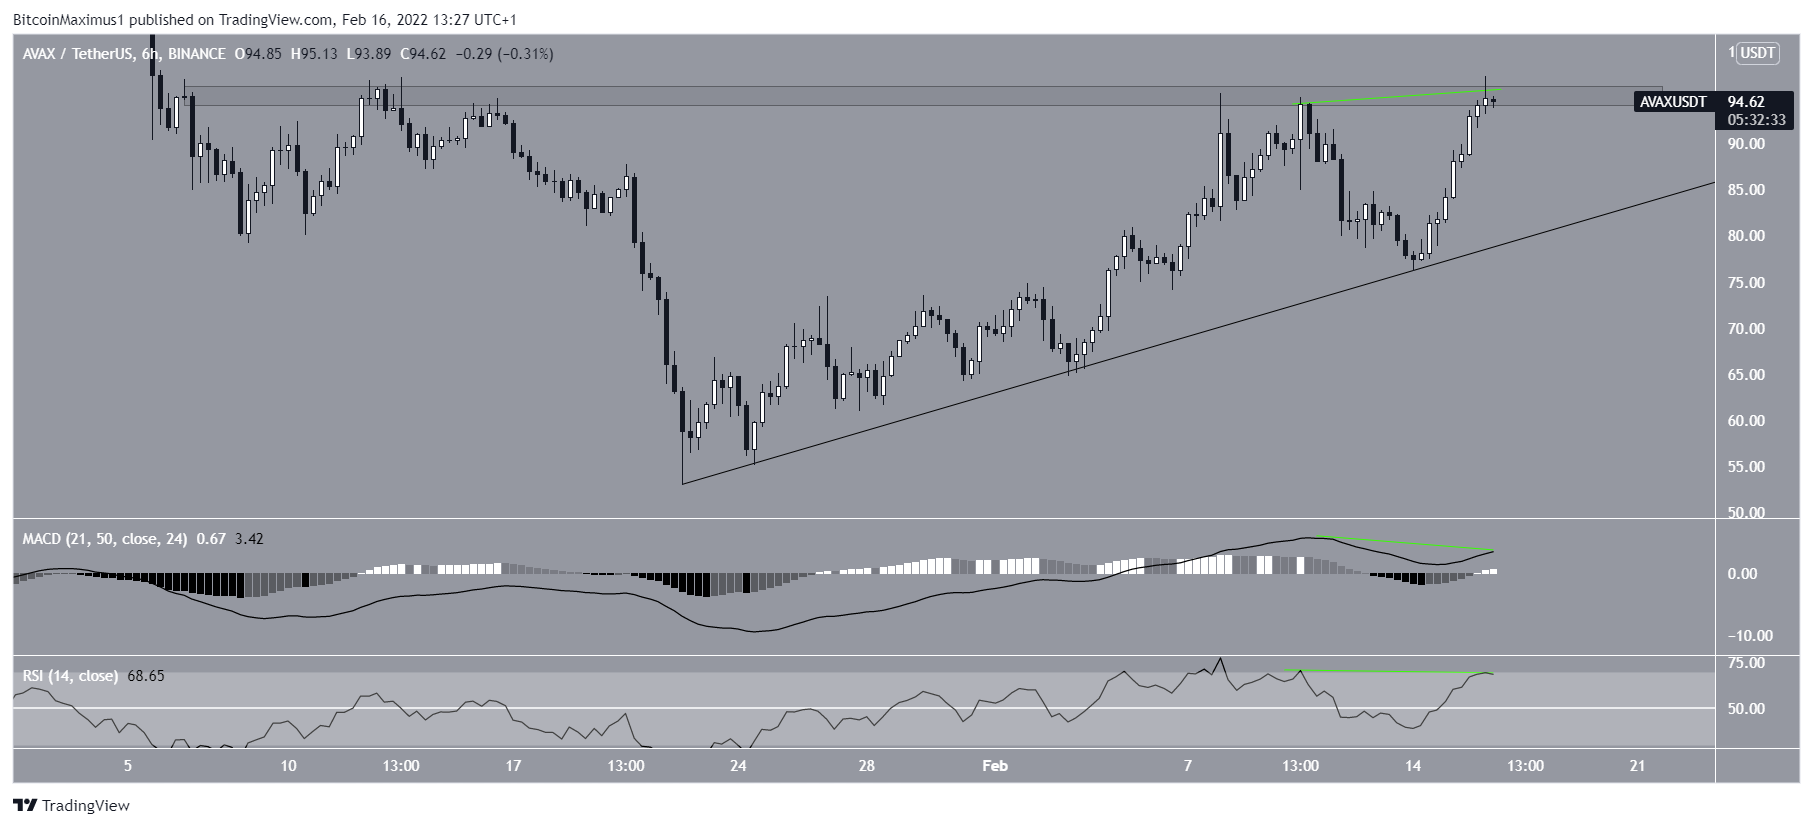
The six-hour chart also gives mixed readings. While both the MACD and RSI are increasing, both have generated bearish divergences, which are more pronounced in the former.
In addition to this, the importance of the $95 resistance area is strengthened, since it is shown to be a horizontal resistance level tested twice prior.
On the other hand, AVAX seems to be following an ascending support line.
Due to the mixed signs, whether AVAX manages to break out above the $95 resistance or breaks down from the ascending support line instead will likely determine the direction of the future trend.
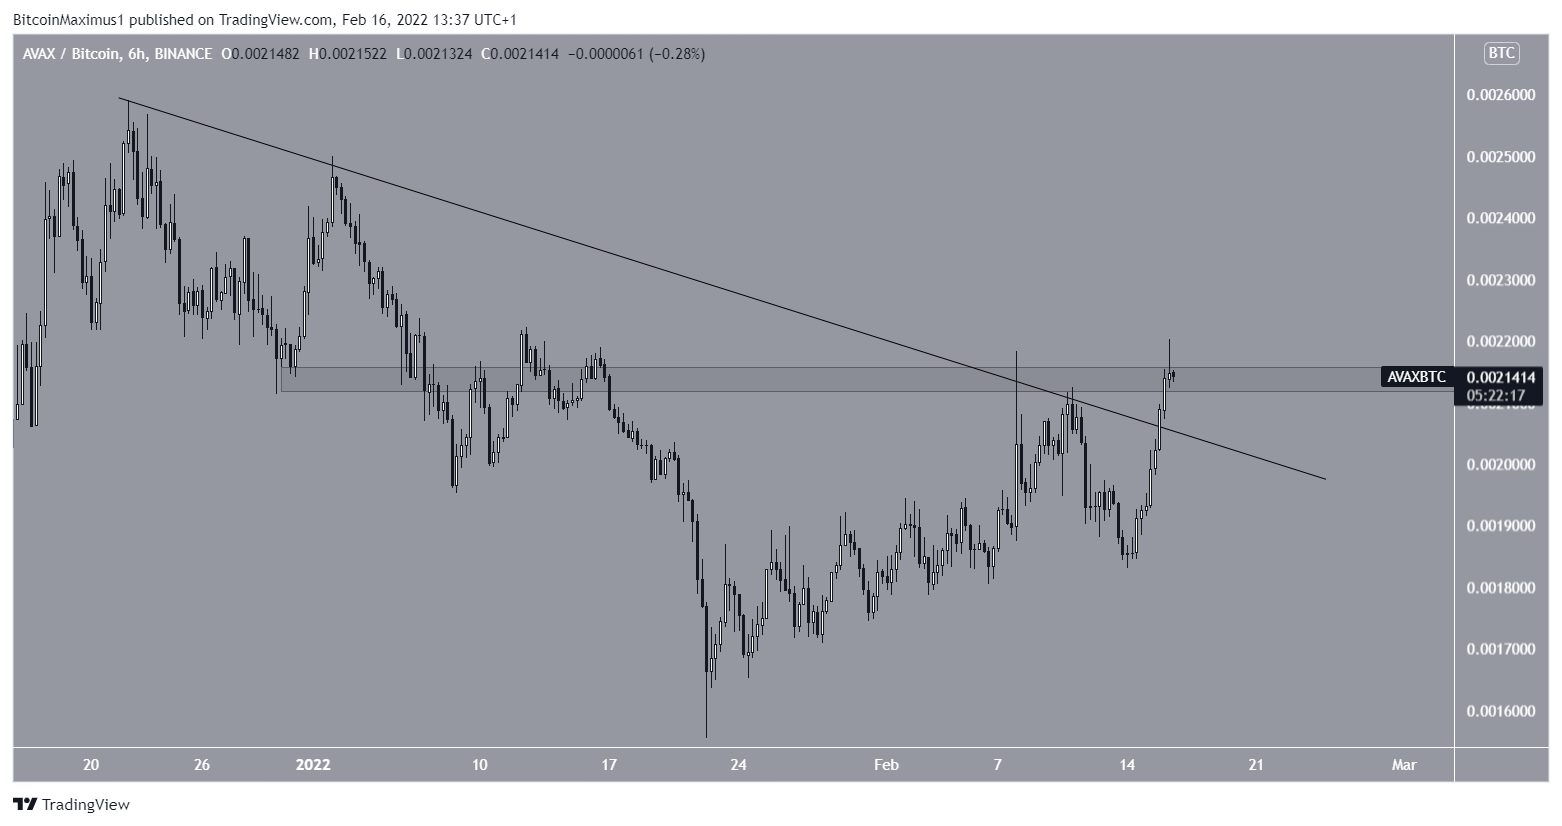
AVAX/BTC
The AVAX/BTC pair shows a nearly identical movement, since the price has broken out from a descending resistance line, but is struggling with the 214,000 resistance area.
Whether it manages to reclaim it or gets rejected will likely determine the direction of the next move.
For BeInCrypto’s latest Bitcoin (BTC) analysis, click here